Is gold and the gold-related (NYSE:GLD) Exchange Traded Fund forming a more complex 4th wave? Using the Elliott Wave Principle (EWP), as I have over the past three weeks, I continue to track its progress and hopefully be able to understand its current price action.
Last week I found, “the glass is starting to fill back up in favor of the bulls. As long as yesterday’s low at $179.73 holds, then GLD can move higher. A close back above the 20-d SMA will add further weight to the evidence red wave-v to ideally around $207 is under way. A close below yesterday’s low will ideally target the c=a extension at around $174ish. Thus, at this stage, there is an around 1.5-2% downside risk and a 13% upside reward set up for a long trade, which I will take. Yes, I put my money where my mouth is.”
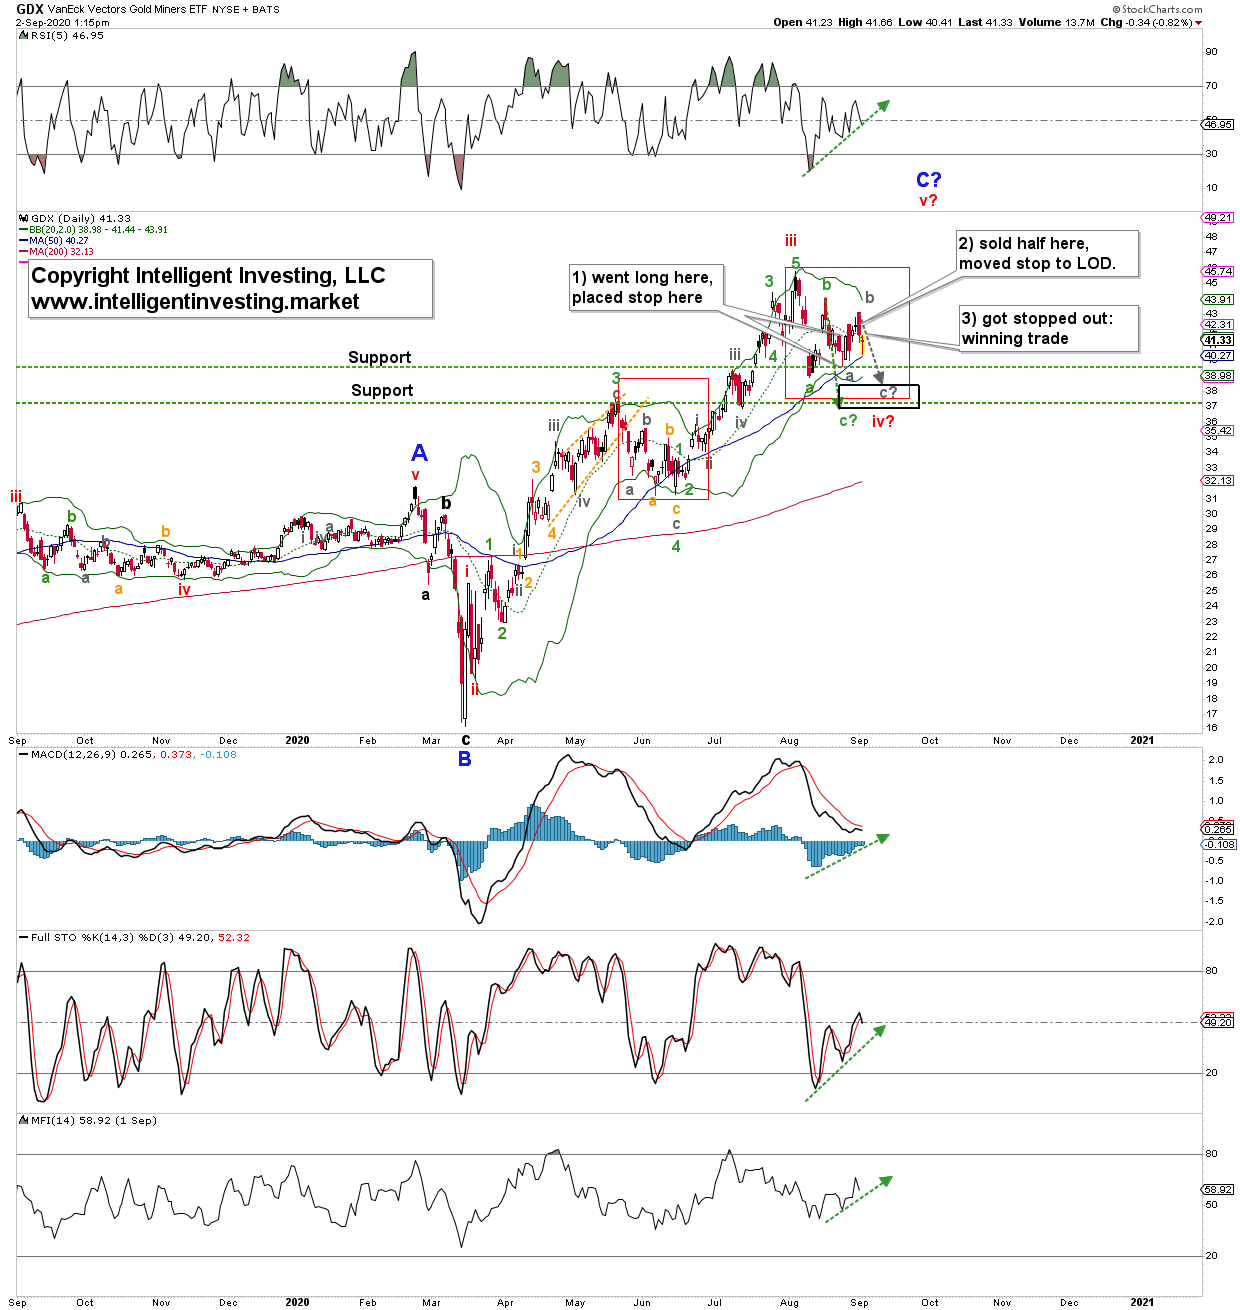
Unfortunately, the day after my last update on Aug. 26, GLD moved below the prior low of $179.73 and stopped me out. It then reversed course the very next day. Typical. But I did not chase it. Instead, I was still long the Goldminer ETF (NYSE:GDX) as well, as that position did not get stopped out because it did not make a lower low, and traded that one successfully instead, making up for some of my losses.
See Figure 1 below with my trades. These trades are tweeted in real-time via my private twitter trading feed service.
Figure 1. GDX daily candlestick chart with EWP count.

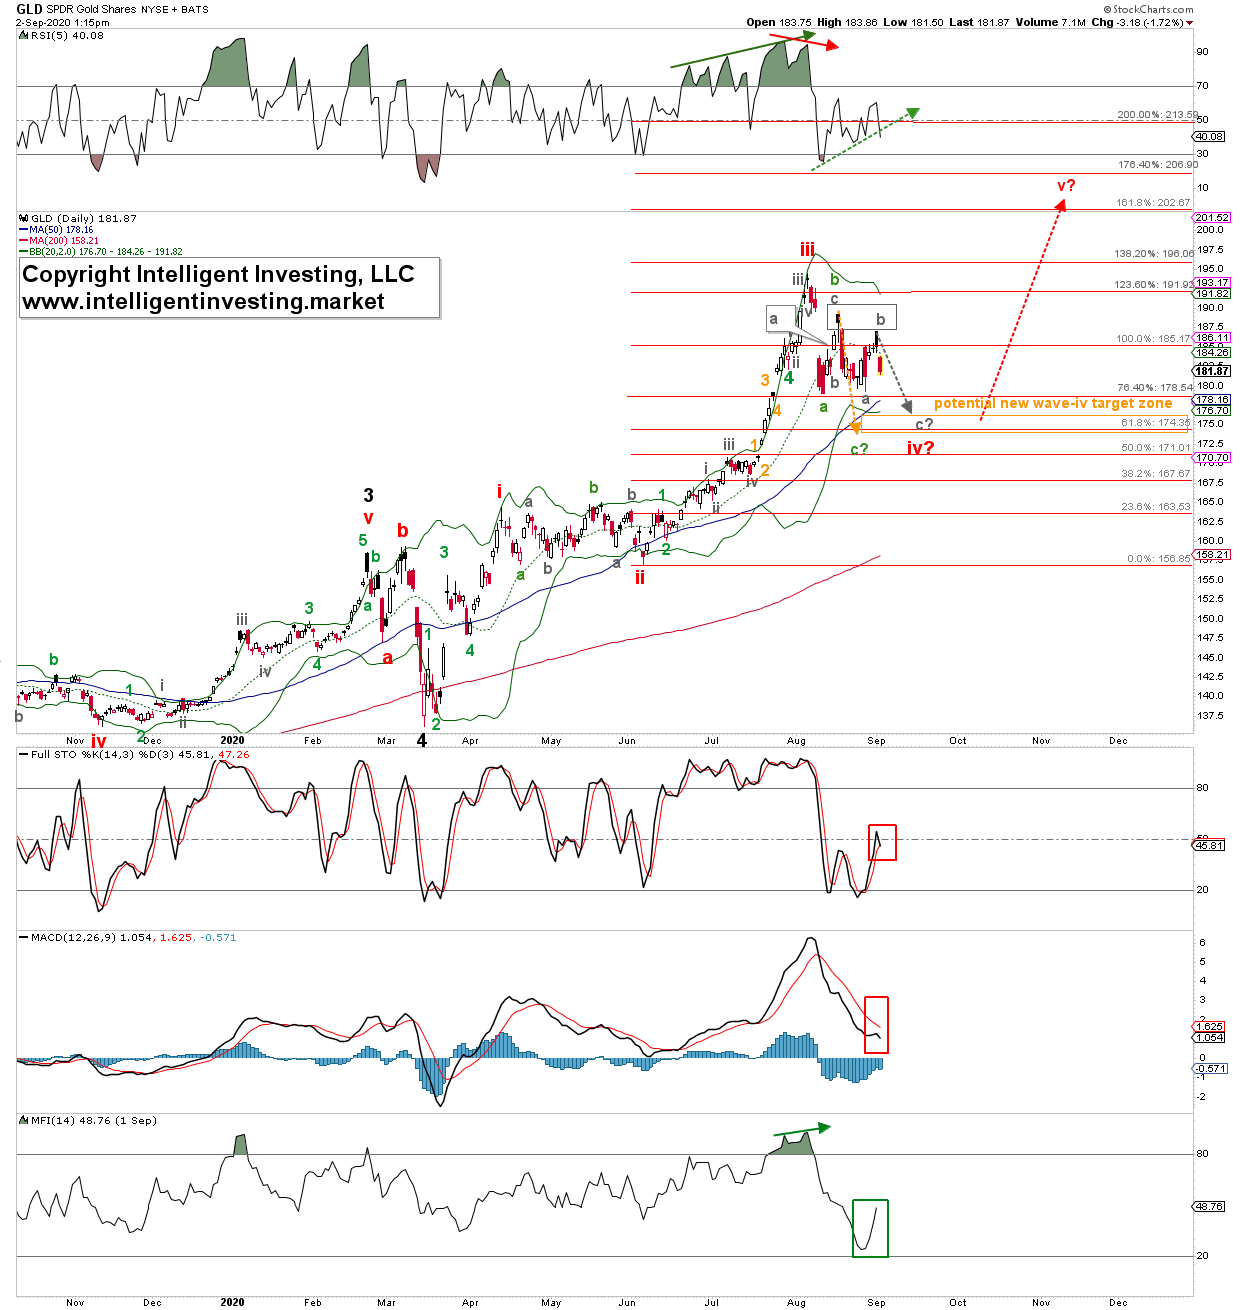
If I continue with the GDX chart for form, it appears as if the current correction is of the same pattern as the (green) wave-4 correction in June: initial drop for an a-wave, corrective bounce for a larger b-wave, then another slide and rally, followed by a final descent to complete the pattern. This pattern is not as apparent for GLD, see Figure-2 below, but as long as yesterday’s high holds, I prefer to view that high as (grey) wave-b. This EWP count means (grey) wave-c of (green) wave-c of (red) wave-iv should now be under way.
With both instruments (GDX and GLD) back below their 20-day Simple Moving Averages, I prefer to look lower also because their technical indicators are starting to point back down: red boxes in Figure 2. But, the Money Flow Index (MFI14) is now beginning to increase, green box, which means money is flowing back into the instrument. Since liquidity is one of the main drivers of a rally, it could mean the correction is nearing its end.
Figure 2. GLD daily candlestick chart with EWP count.

Bottom line: GDX and GLD had the setup in place last week to move higher, which they did but only briefly. In the previous two days, both instruments failed to follow through as they made a lower high. It, therefore, appears both go through the wringer of the - per usual - more complicated and confusing 4th wave correction. This is why my GLD and GDX trades got stopped: I prefer not to stay in and trade whipsaws. Luckily, one was only a small losing trade, and one a winning trade, making up some of the losses. That is why I always say, “all one can do is 1) anticipate, 2) monitor, and 3) adjust if necessary. A flexible open mind is required to analyze and trade the markets well.” From a trading perspective: always keep losses small, sell into strength, and raise stops to lock in your remaining profits. You earned it.
As long as these instruments remain below their highs of the week, I prefer to look lower. The ideal target zone for the preferred wave-iv pattern is for GLD $174-176, and for GDX $36.5-38.50. In next week’s update, I will share my GOLD chart with you.
