Markets were pretty quiet as would be expected until Thursday when we saw a nice down day on stronger volume. This is fine so far and the trend remains solidly in the upwards direction.
Dips are still to be bought until it stops working. Keep it simple and it will work well.
All market participants will be back Monday so expect volume to pickup a bit and hopefully we can see some more volatility with that.
As for the metals, who’ve had a decidedly lower trend for quite some time now, gold looks to have put in it’s double bottom on the last possible day of 2013
Gold is just so funny.
There is no doubt large money moves it around, but large money moves all stocks so there is nothing to really argue about there.
That said, it’s funny to me how they put golds low in on the last day of the year.
You can picture the big money boys laughing at this inside joke.
We are looking like a low is in now though, so let’s take a look at the charts and see what I’m seeing this weekend.
Let’s begin with a monthly chart of gold which shows a nice double bottom.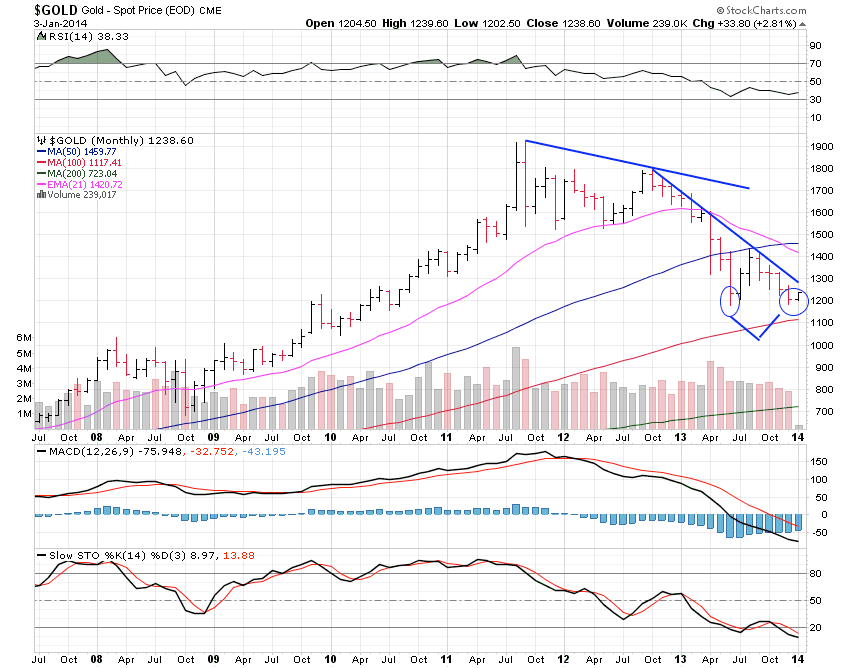
Gold has put a in double bottom, and is now at the $1,200 area which is a strong support level.
The 100 month average is not far below and also provides support.
The double bottom isn’t ideal here, but it’s in, and now I’m looking for higher prices but we do have a large hurdle to clear in the long descending trend-line at the $1,270 level.
I’m happy to see a double bottom on the monthly chart since it represents a much stronger and significant milestone.
The daily chart is great for swing trading for days to weeks while the monthly chart can be used to find trends that last years.
Hopefully this is the beginning of a long strong trend higher.
All that said, nothing in life is ever for sure so a move into new lows would cancel the double bottom and be a sell signal with $1,000 as the next major support level.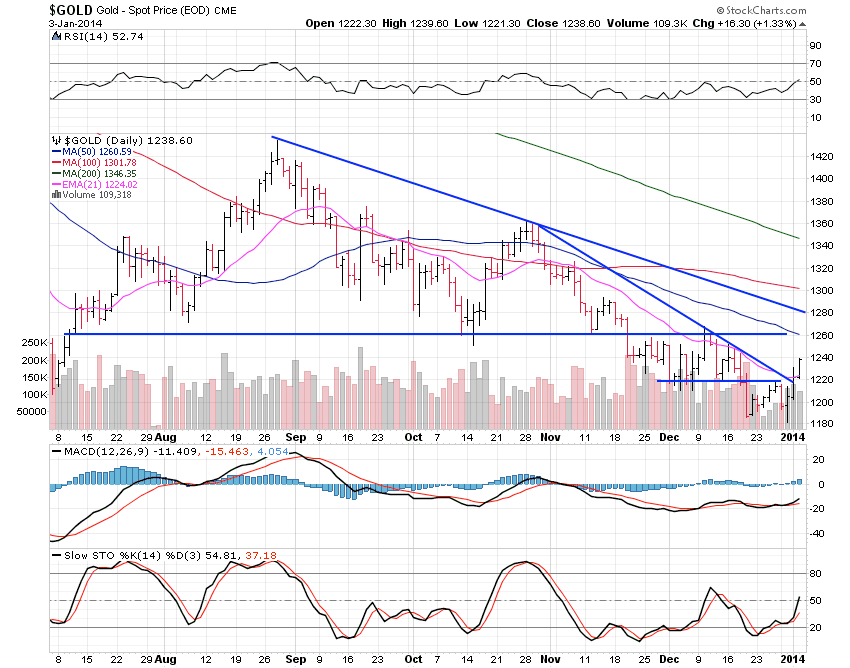
Gold rose 2.05% on the week and has now cleared the important $1,220 level.
It’s looking great here.
2014 could be a great year for gold but I’m not expecting or hoping for new highs, rather a couple or few years slowly moving higher towards $1,900 would be ideal.
It’s all about building support level on the way up so we have a solid platform to launch from.
All in all, I’m very impressed with the action gold has shown us to end 2013 and begin 2014.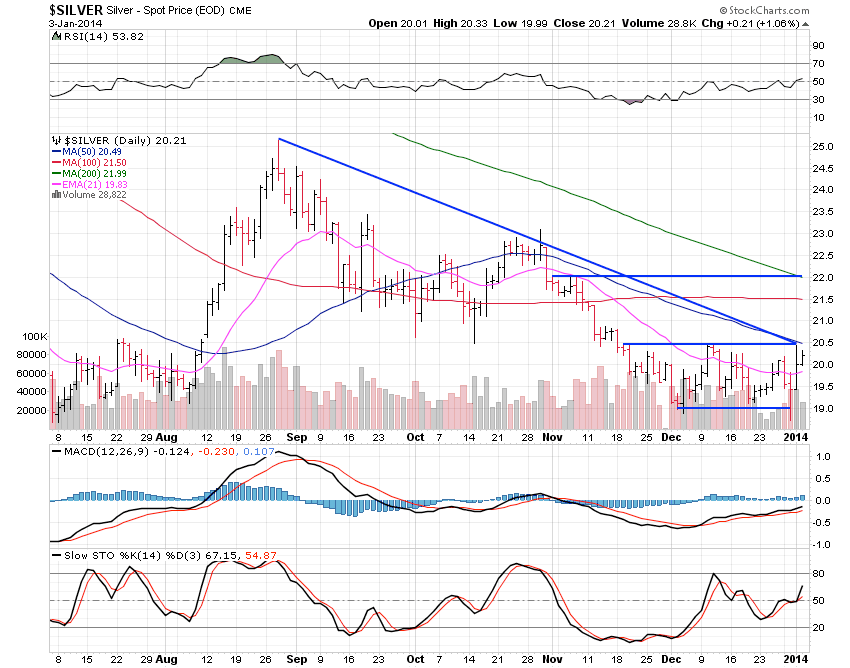
Silver gained 0.42% for the week and is trying to turn up with gold.
Gold will lead the other precious metals higher.
Silver has resistance meeting at $20.50 with both horizontal resistance and a long descending trend-line merging.
Once we move above $20.50 then $22 is the next area to look for resistance.
We should see this move towards $22 begin this coming week, as early as Sunday night in overseas action as so often happens.
All in all, we’re looking good and I’d consider starting to buy or add to a physical precious metals position here now.
There is no real shortage of bullion for the average investor.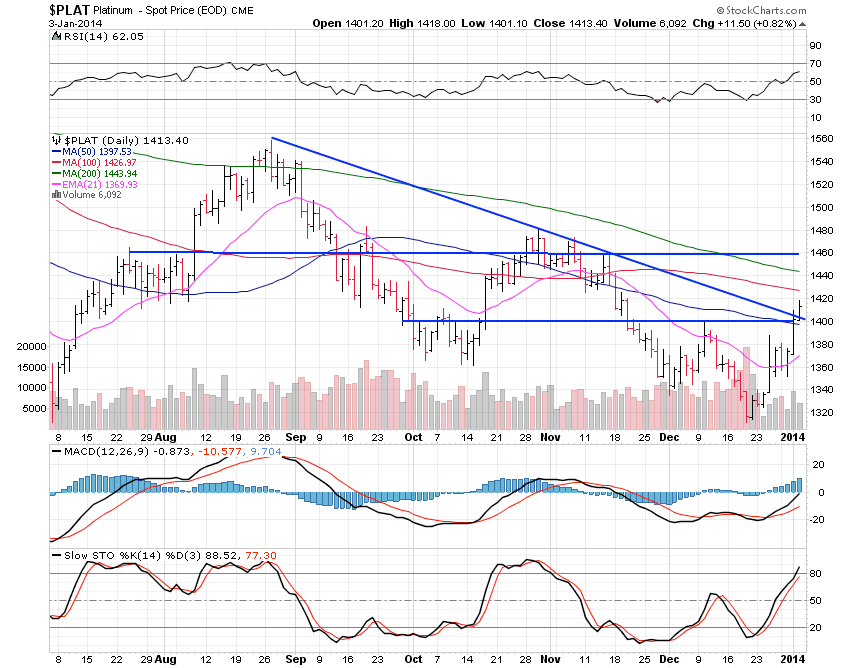
Platinum had a nice week rising 2.85% and moving above the $1,400 resistance level where the long downtrend line also has merged.
Great action that should soon see $1,460.
The 200 day moving average and horizontal support sits at $1,440 so we should see at least a few days or consolidation around that level before we move to $1,460 and on to $1,520 from there.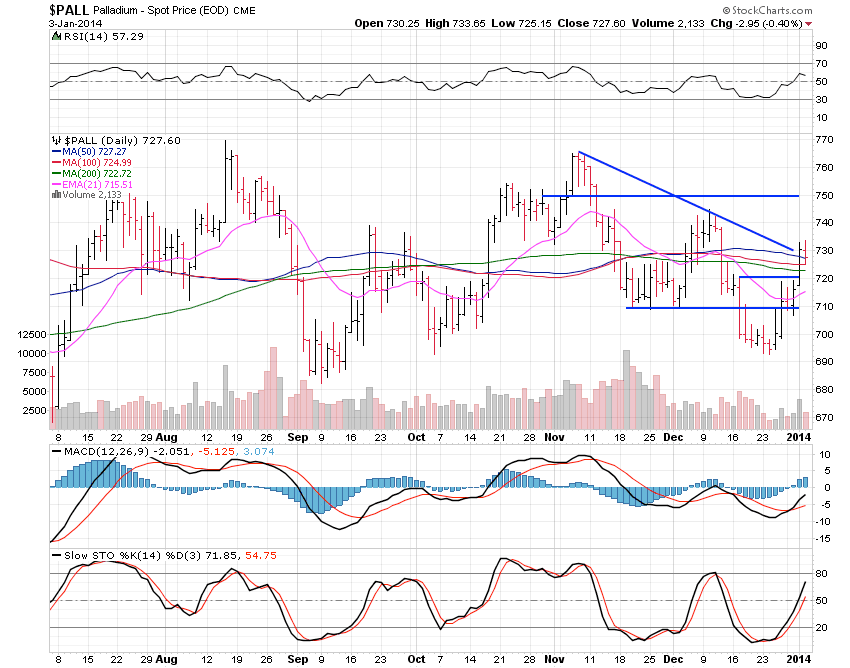
Palladium gained 2.25% this past week and is moving above the moving average cluster between $720 and $730.
It’s looking great now for a move to $750, then $765.
All in all things are really looking up for the precious metals for the first time in well over a year.
Gold topped out over 2 years ago but based at a high level before really starting to drop off in October of 2012.
We could take a solid year or two now to slowly move up to the $1,560 area building a solid support/base area along the way.
Then it would be nice to see another year or two of basing under $1,800 before we begin a major run.
This would be great to see and should spark a run like the one we saw from $1,000 which effectively doubled the gold price in a couple years.
Just a rough outlook would take us to the $4,000 area in time.
It won’t come quick, but that's ok.
I focus on what’s moving now and there are a few mining stocks who are showing me signs of a bottom here and are very, very cheap so I may pick some up for a long-term hold.
It will be years though before we see the gold stocks as the go to, high-beta momentum stocks I like to focus on.
If you’re a bottom fisher, start setting the hook but momentum traders are in no rush.