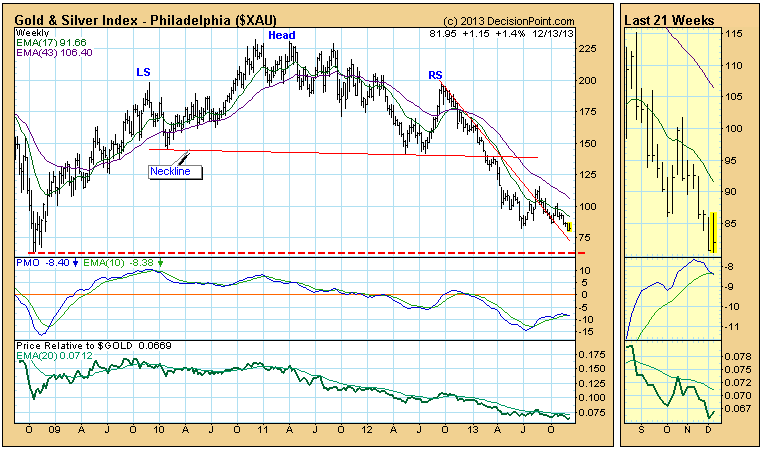
The Gold and Silver Index (XAU) represents a group of precious metal mining stocks. It is in a major decline from the 2010 top.
We have watched the XAU form a massive head and shoulders pattern for over three years. The neckline was violated this year, and the technical downside target was somewhat below the horizontal support line drawn from the 2008 low, so it would seem that there is more downside to go before the target is reached.
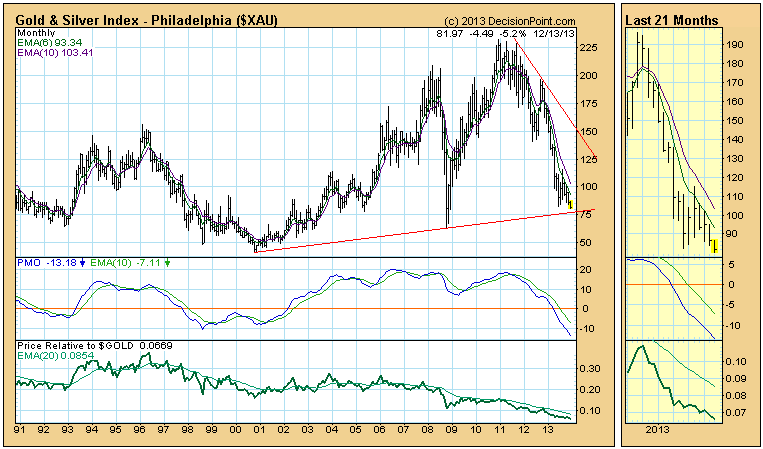
But not so fast. Zooming back on the monthly chart we can see that price is approaching a long-term rising trend line that is currently slightly above 75 and just below the price index. It is possible that a bottom may be close at hand. That would be good news for those who have watched it lose about 85% of its gains since the low in 2000.
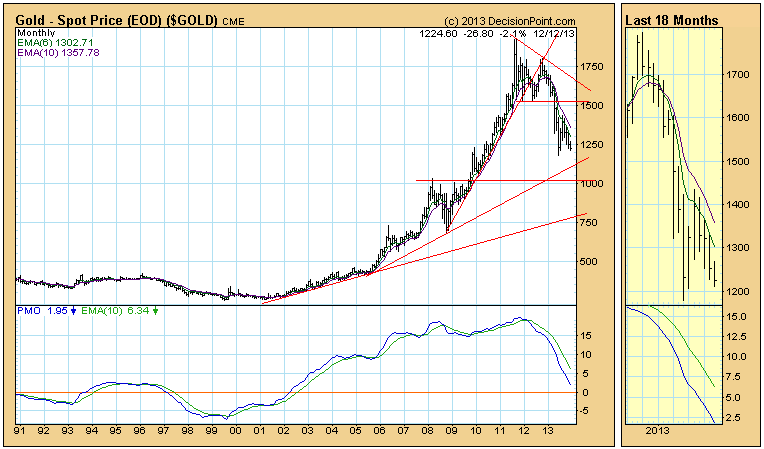
Sometimes people wonder if the XAU is a good surrogate for gold. As you can see comparing the chart below with the one above, it would be hard to make a case for that.
Conclusion: The XAU has been in a severe bear market since the 2010 top, but a long-term rising trend line presents a credible area of support at around 75. That would be a good place for a bottom to form. We'll be watching.
by Carl Swenlin
- English (UK)
- English (India)
- English (Canada)
- English (Australia)
- English (South Africa)
- English (Philippines)
- English (Nigeria)
- Deutsch
- Español (España)
- Español (México)
- Français
- Italiano
- Nederlands
- Português (Portugal)
- Polski
- Português (Brasil)
- Русский
- Türkçe
- العربية
- Ελληνικά
- Svenska
- Suomi
- עברית
- 日本語
- 한국어
- 简体中文
- 繁體中文
- Bahasa Indonesia
- Bahasa Melayu
- ไทย
- Tiếng Việt
- हिंदी
Gold Miners Near Support
Latest comments
Loading next article…
Install Our App
Risk Disclosure: Trading in financial instruments and/or cryptocurrencies involves high risks including the risk of losing some, or all, of your investment amount, and may not be suitable for all investors. Prices of cryptocurrencies are extremely volatile and may be affected by external factors such as financial, regulatory or political events. Trading on margin increases the financial risks.
Before deciding to trade in financial instrument or cryptocurrencies you should be fully informed of the risks and costs associated with trading the financial markets, carefully consider your investment objectives, level of experience, and risk appetite, and seek professional advice where needed.
Fusion Media would like to remind you that the data contained in this website is not necessarily real-time nor accurate. The data and prices on the website are not necessarily provided by any market or exchange, but may be provided by market makers, and so prices may not be accurate and may differ from the actual price at any given market, meaning prices are indicative and not appropriate for trading purposes. Fusion Media and any provider of the data contained in this website will not accept liability for any loss or damage as a result of your trading, or your reliance on the information contained within this website.
It is prohibited to use, store, reproduce, display, modify, transmit or distribute the data contained in this website without the explicit prior written permission of Fusion Media and/or the data provider. All intellectual property rights are reserved by the providers and/or the exchange providing the data contained in this website.
Fusion Media may be compensated by the advertisers that appear on the website, based on your interaction with the advertisements or advertisers.
© 2007-2025 - Fusion Media Limited. All Rights Reserved.


