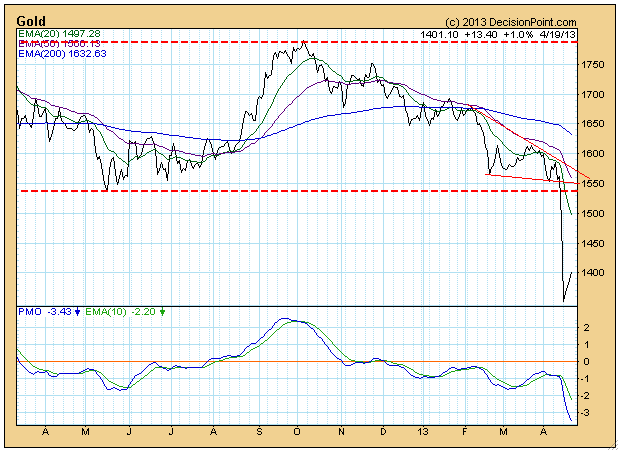
Over the last few weeks, gold experienced a major breakdown. There are of course many opinions as to what will happen next. Let's take a broad look at the technicals, so that we have some context for making decisions.
The daily chart shows the critical break below long-term support at about 1540. The bounce off the low is unlikely to be the beginning of a new rally; we think it is a short-term consolidation, like a reverse flag or pennant.
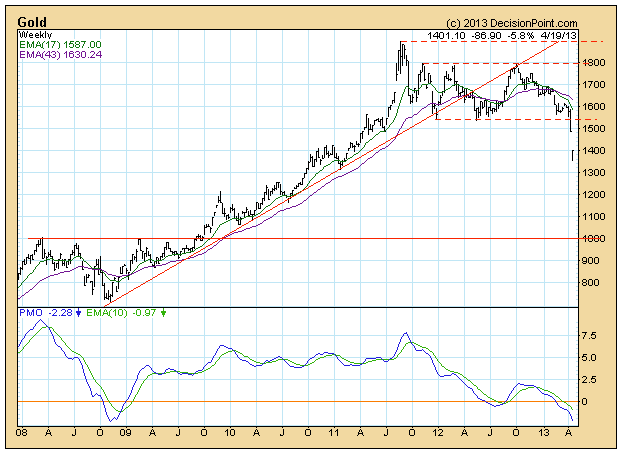
The weekly chart gives the best view of the trading range that has kept prices contained for over a year and a half. We thought that this was a price consolidation that would eventually lead to higher prices, so the failure of support was disappointing and has very negative long-term significance.
On the charts above you will notice that both the daily and weekly PMOs (Price Momentum Oscillators), are at the oversold side of the range shown on the charts, but a longer-term view below shows that neither PMO is challenging historical lows.
The monthly chart below gives the best perspective for gold's long-term prospects. While the top is broader than usual, we believe that we are seeing a collapsing parabolic. The "parabolic" is the gradually steepening curve as prices rose from the 2001 lows to the 2011 top. Typically, parabolics collapse back into their original basing range. For gold, this range (based upon the price history visible on the weekly chart just above) is between about 250 and 500. I agree that doesn't sound reasonable, but it does fit normal expectations for a parabolic collapse.
In our opinion, the most obvious support level at this point is at about 1000. Support could easily be found higher than that, but for now let's stick to the obvious when estimating where a solid bottom could be found.
Conclusion: Long term, the trend for gold is down, and the condition, based upon the monthly PMO, is much overbought; therefore, we have to assume that outcomes will be negative until some improvement is seen.
- English (UK)
- English (India)
- English (Canada)
- English (Australia)
- English (South Africa)
- English (Philippines)
- English (Nigeria)
- Deutsch
- Español (España)
- Español (México)
- Français
- Italiano
- Nederlands
- Português (Portugal)
- Polski
- Português (Brasil)
- Русский
- Türkçe
- العربية
- Ελληνικά
- Svenska
- Suomi
- עברית
- 日本語
- 한국어
- 简体中文
- 繁體中文
- Bahasa Indonesia
- Bahasa Melayu
- ไทย
- Tiếng Việt
- हिंदी
Gold May Witness Recovery From Lower Levels
Published 04/22/2013, 06:30 AM
Updated 05/14/2017, 06:45 AM
Gold May Witness Recovery From Lower Levels
Latest comments
Loading next article…
Install Our App
Risk Disclosure: Trading in financial instruments and/or cryptocurrencies involves high risks including the risk of losing some, or all, of your investment amount, and may not be suitable for all investors. Prices of cryptocurrencies are extremely volatile and may be affected by external factors such as financial, regulatory or political events. Trading on margin increases the financial risks.
Before deciding to trade in financial instrument or cryptocurrencies you should be fully informed of the risks and costs associated with trading the financial markets, carefully consider your investment objectives, level of experience, and risk appetite, and seek professional advice where needed.
Fusion Media would like to remind you that the data contained in this website is not necessarily real-time nor accurate. The data and prices on the website are not necessarily provided by any market or exchange, but may be provided by market makers, and so prices may not be accurate and may differ from the actual price at any given market, meaning prices are indicative and not appropriate for trading purposes. Fusion Media and any provider of the data contained in this website will not accept liability for any loss or damage as a result of your trading, or your reliance on the information contained within this website.
It is prohibited to use, store, reproduce, display, modify, transmit or distribute the data contained in this website without the explicit prior written permission of Fusion Media and/or the data provider. All intellectual property rights are reserved by the providers and/or the exchange providing the data contained in this website.
Fusion Media may be compensated by the advertisers that appear on the website, based on your interaction with the advertisements or advertisers.
© 2007-2025 - Fusion Media Limited. All Rights Reserved.
