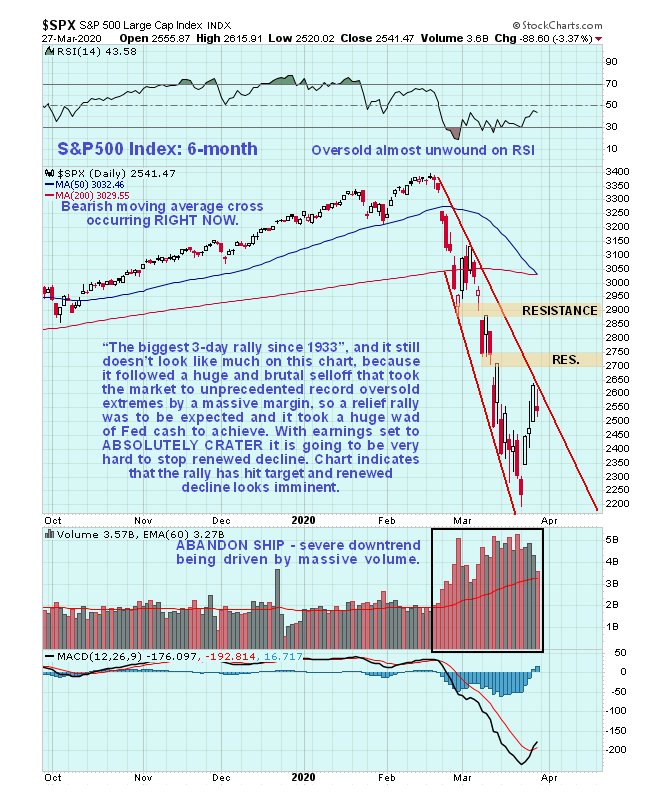
As you probably saw the mainstream media had its trumpets blaring last week “Biggest 3-day rally since 1933 – the coast is clear, roll up and buy”. We saw this rally coming, as you may remember, and it doesn’t change anything. All the market did was stage a classic snapback relief rally from a record by far oversold condition, so it was easy for the Fed to get it moving up by throwing a trillion or two at it. With corporate earnings set to crater it should soon start dropping again in earnest.
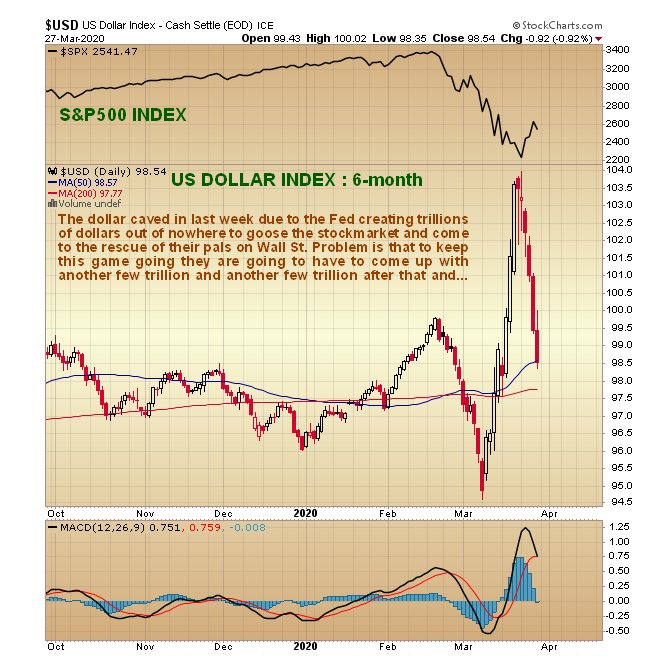
With margin call pressure easing due to the rally and the Fed’s money factory taking it to the next level to fund its rabid buying spree, the dollar responded by caving in last week and giving back a large slice of its earlier spike gains…
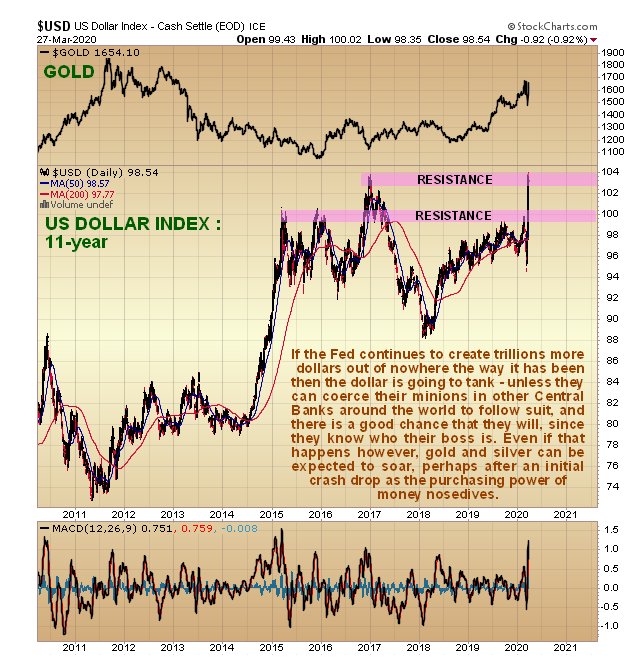
If the Fed continues to churn out trillions of new dollars, then we can expect the dollar index to tank, unless that is, they can get the subservient vassal Central Banks (who they are flooding with dollars) such as the ECB and the BOJ to do likewise, and that seems likely given that they are faced with a similar crisis. The key point for Precious Metal investors to take away from this is that, no matter how the dollar performs relative to other currencies, money supply in all countries will be ballooning at a fantastic unprecedented rate as they struggle to meet obligations and maintain liquidity, which means that, measured against real money, which is gold, they will be cratering. On its 11-year chart we can see that the dollar index has been in an erratic holding pattern for 5 years now, and the next stockmarket hit should see it again try to break out of the top of this pattern, unless it is swiftly countered by another tsunami of Fed largesse. The dollar is often strong during market crash phases, which is one reason Precious Metals often drop hard during this phase before recovering quickly when the crash phase is over.
There are a number of reasons to believe that gold and silver will get taken down again once the market starts to plunge again, despite the increasingly acute shortage of the physical metals.
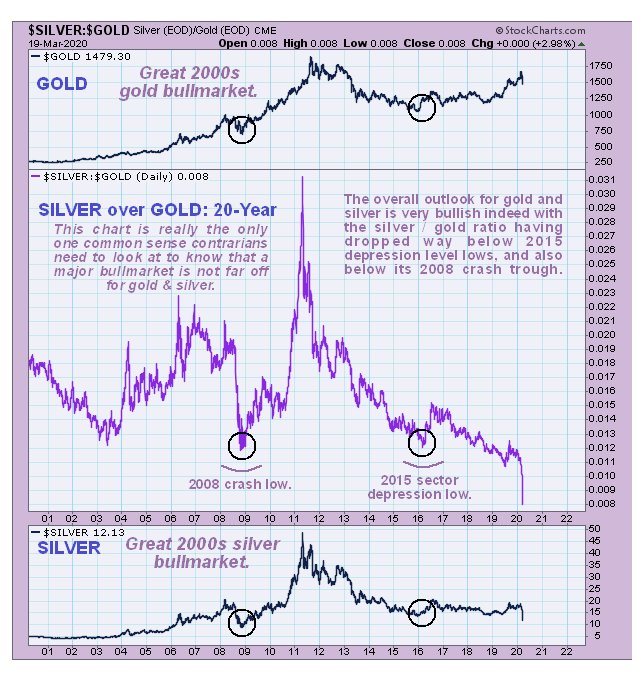
PM stocks are underperforming gold right now, which is viewed as a warning, and the silver chart continues to look awful following its recent severe breakdown. That said, there is light at the end of the tunnel, as we can see with the silver to gold ratio shown below being at levels that strongly suggest that a humongous sector bull market is brewing, and not far out, which is hardly surprising given the chronic shortage of physical metal, and silver’s COT (shown in the parallel Silver market update) is rapidly improving. Thus, what is expected is another drop in sympathy with a crashing stock market, and then, immediately the crash phase is over, or even before, a scorching rally, as happened from the 2008 – 2009 crash low, only this time much stronger.
A subscriber wrote me early last week essentially saying “Maund, what do you mean? – you say that the PM sector is going to rally, then drop more, then rally again – I’m confused, what are you talking about? So, in an effort to clarify this prediction I present the following prediction chart for GDX…
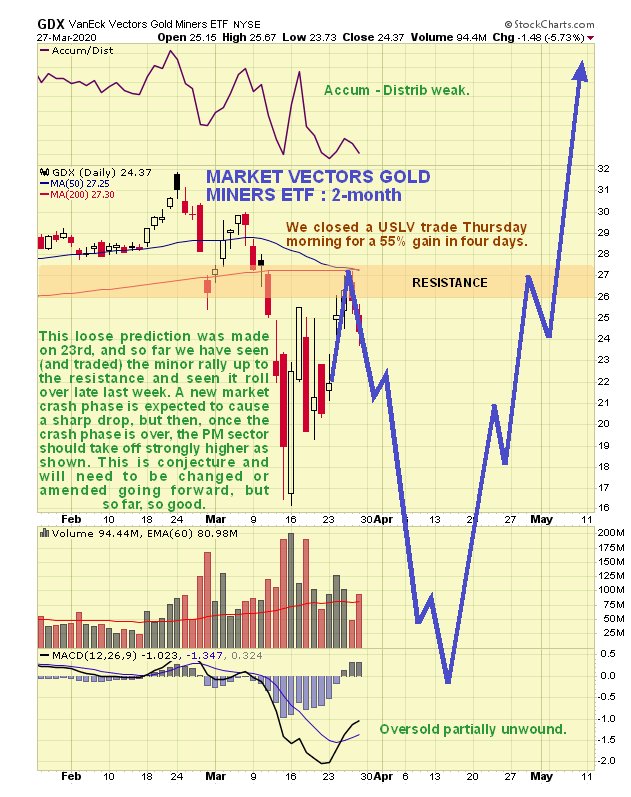
The minor rally that was expected has occurred and we traded this successfully, buying silver ETFs and Calls, and taking profits several days later, selling highly leveraged USLV for a 55% gain in four days. We would have made a similar amount in NUGT had the management of this ETF not moved the goalposts, so we escaped with only about an 8% gain before it started to drop back, resolving never to touch this one again. This is why we generally much prefer options to leveraged ETFs. With options you can’t be swindled out of your gains to anywhere near the same extent – they don’t need to swindle you because they make enough out of eroding time values and spreads. GDX started rolling over again beneath resistance after we cleared out and now looks set up to drop hard as shown, in sympathy with another severe decline in the stock market, but after that it should take off like a rocket as the physical shortage of metal really starts to bite.
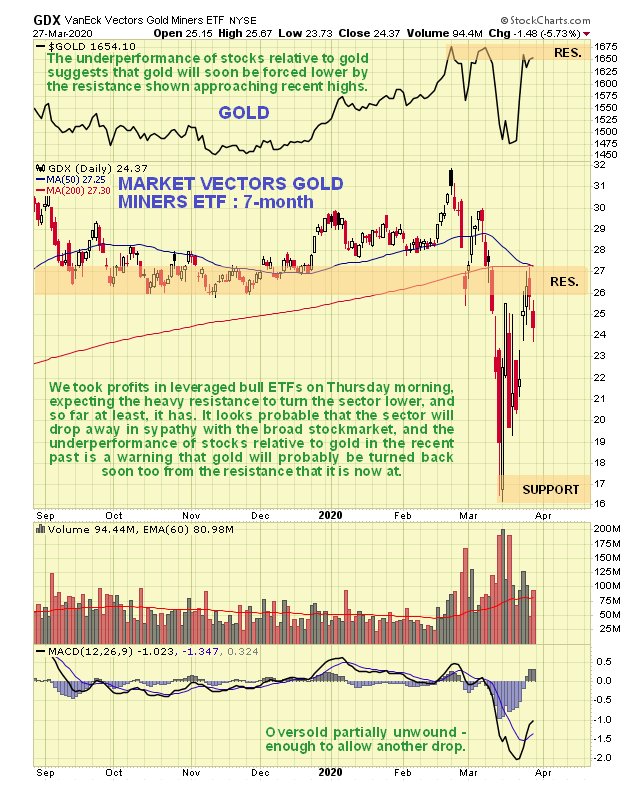
Here is the normal 7-month chart for GDX which looks bearish. We had a breach of very important support earlier this month that was followed by a savage drop. Then it bounced back in tune with a rising stock market and falling dollar last week, but the rally was capped by the earlier support that has become heavy resistance and it is now rolling over ominously again, and as mentioned above is expected to drop hard with the stock market. This is made more likely by the bearish cross of the moving averages now occurring. Needless to say, this does not bode well for gold and silver near-term.
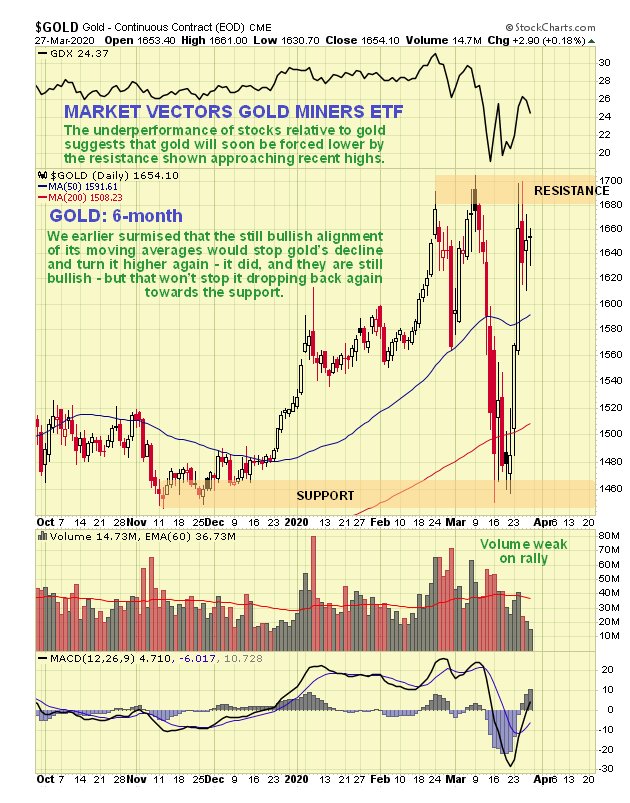
On gold’s latest 6-month chart we can see why it looks like it will drop back again over the near-term, as it has stalled out at a clear resistance level at earlier highs. Moving averages are still in bullish alignment so at this point, it looks likely that it will drop back again to the quite strong support in $1450 area that arrested the sharp drop in the middle of the month, but probably not further. However, on this drop, because of the falling stock market, PM stocks are expected to be harder hit, and to drop back below their mid-March lows.
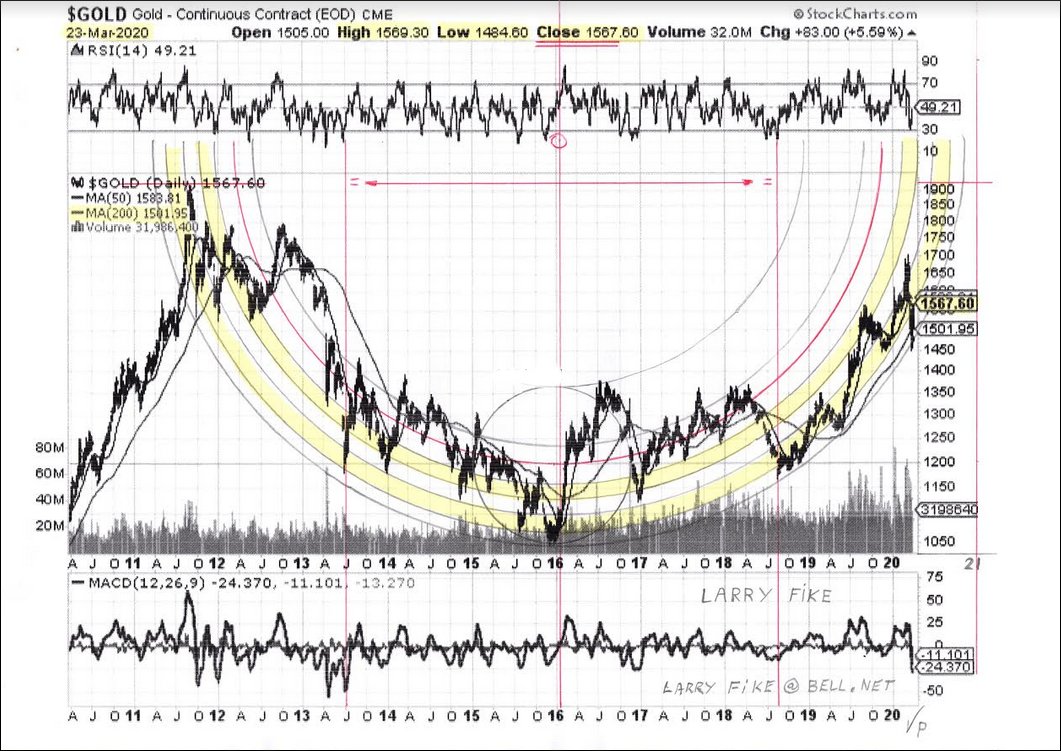
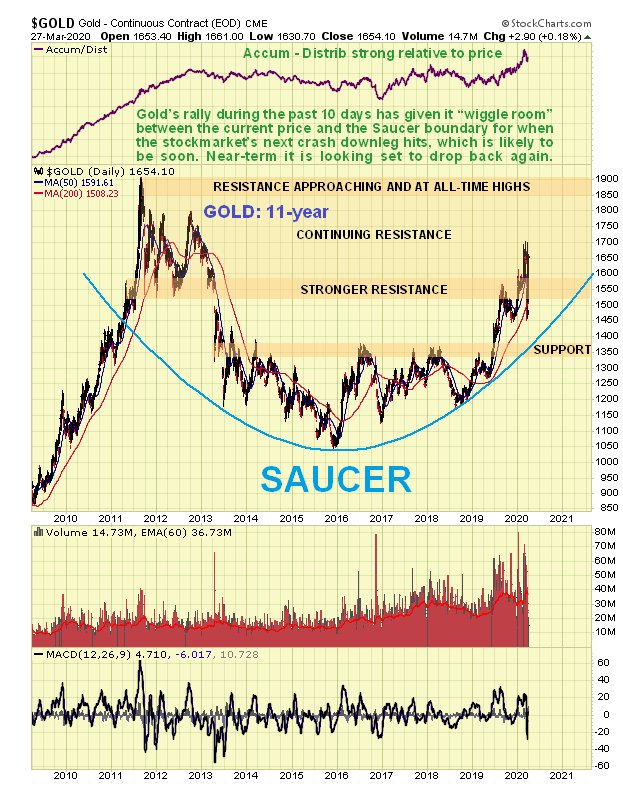
On gold’s 11-year chart we can see that its rally of the past 10 days or so has given it sufficient “wiggle room” to drop back quite hard near-term without violating the supporting Saucer boundary which is later expected to slingshot it to new highs.
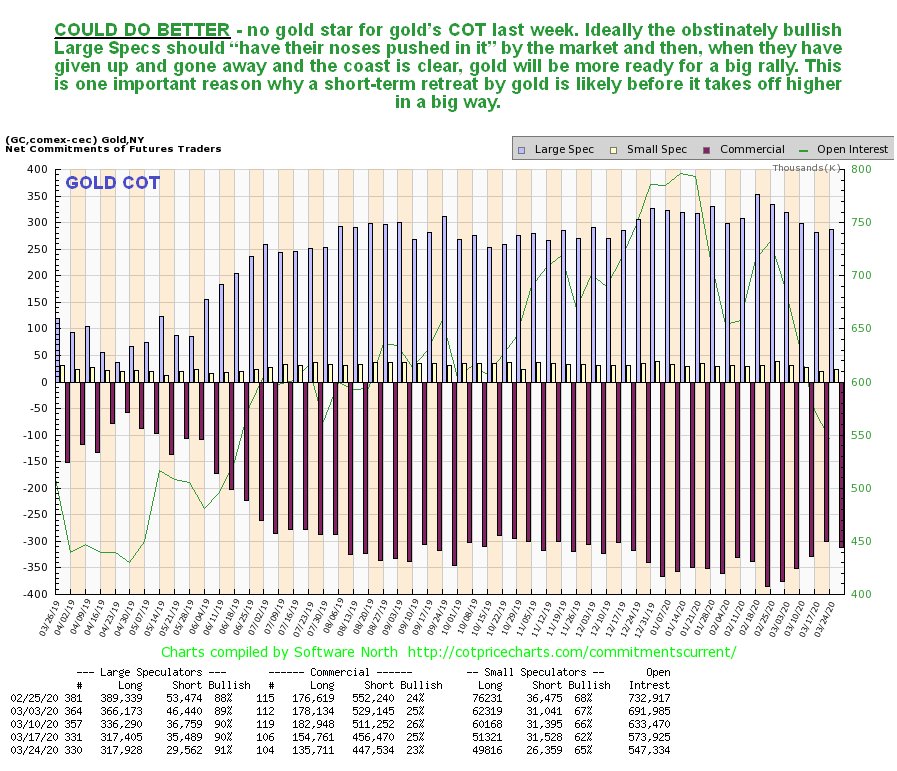
Unlike silver’s COT, gold’s latest COT chart has not improved enough to avert another sharp drop over the near-term, which would actually be a good thing if it cleared out some of these stubborn Large Specs…
Now to look at the latest 1-year chart for the Gold Miners Bullish % Index, which shows that in as short a time as about 2 weeks, PM sector investors have gone from being almost universally bearish, to very bullish, in classic manic-depressive fashion. Since they are, collectively speaking, never happier than when they are part of a crowd, and always wrong, it’s not hard to see why we dumped our long ETFs on Thursday and why we are now negative on the sector for the near-term.
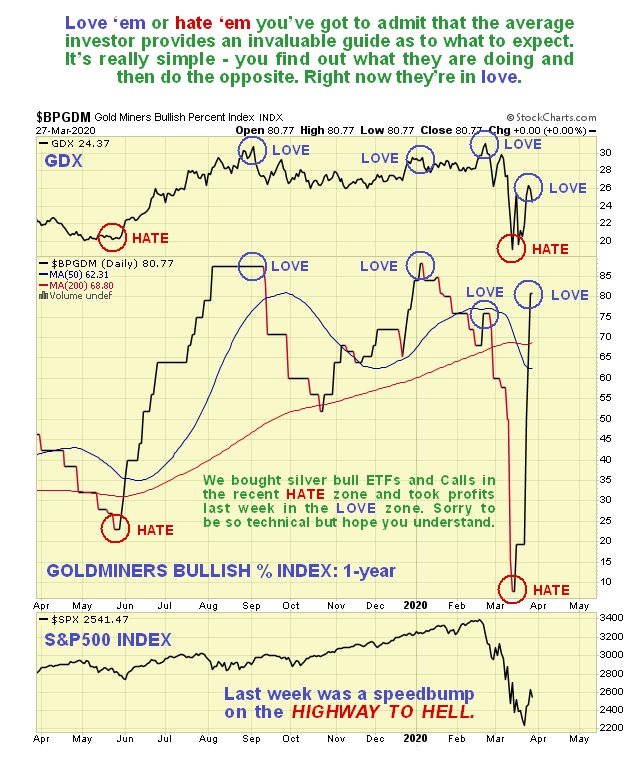
The crowd – you gotta love ‘em – what would we do without them?
Finally, the most important thing for Precious Metals sector investors, or would be Precious Metals sector investors, to keep in mind is that if we do see a short sharp selloff across the sector soon as looks likely, it is expected to be the last and to be followed by a dramatic and possibly breathtaking reversal to the upside, as per the scenario shown on the 2-month GDX chart shown above, and this accords with Larry’s amazing gold chart shown below. On the chart it looks like a drop now will violate the chart, but as Larry himself clarified recently “Note: I am beginning to suspect that there may be one more outside rounding line to add later. The reason I suspect this is the inner line only touches in the center. I may be way off on this – but the suspicions are there.”
