I got pelted with garbage after the last (bearish) update was posted on the 1st because right after, gold zoomed back up following a $75.80 plunge, as we can see on its latest 3-month chart below, and this “swansong rally” even made it to a marginal new high, but it did not negate the bearish implications of the late February plunge.
In the last update it was written “This kind of massive smackdown, which took the gold price straight down to its rising 50-day moving average, is viewed as a clear “shot across the bows” and is interpreted as meaning Big Trouble.” The call was correct as demonstrated by last week’s steep plunge back to the rising 200-day moving average, and by Precious Metals stocks cratering last week in a dramatic manner. Last week’s developments, especially in stocks, means that gold has been “holed below the water line” and should now get taken down hard along with silver as margin call afflicted investors dump everything indiscriminately over the side. 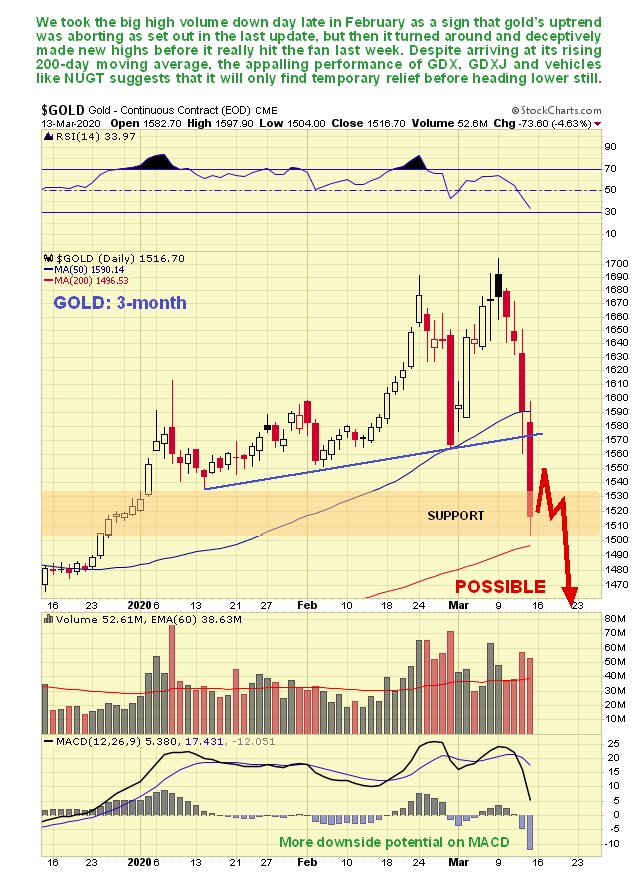
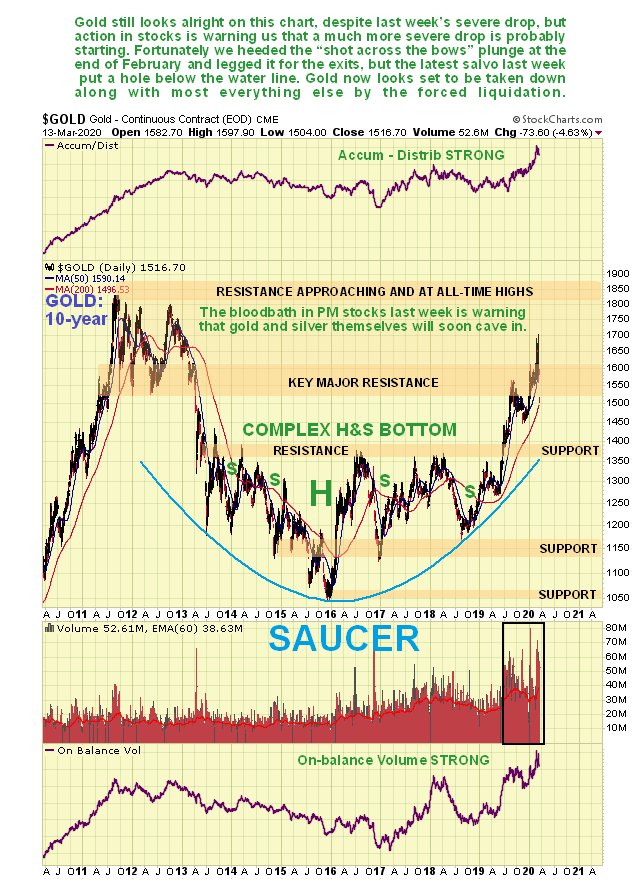
On gold’s 10-year chart you can scarcely see last week’s plunge, and we actually had a pretty decent rally up to just a week ago, but the message of cratering PM stocks is that gold is failing beneath its 2011 peak and will now get taken down along with most everything else. This chart shows that it could drop a long way from here.
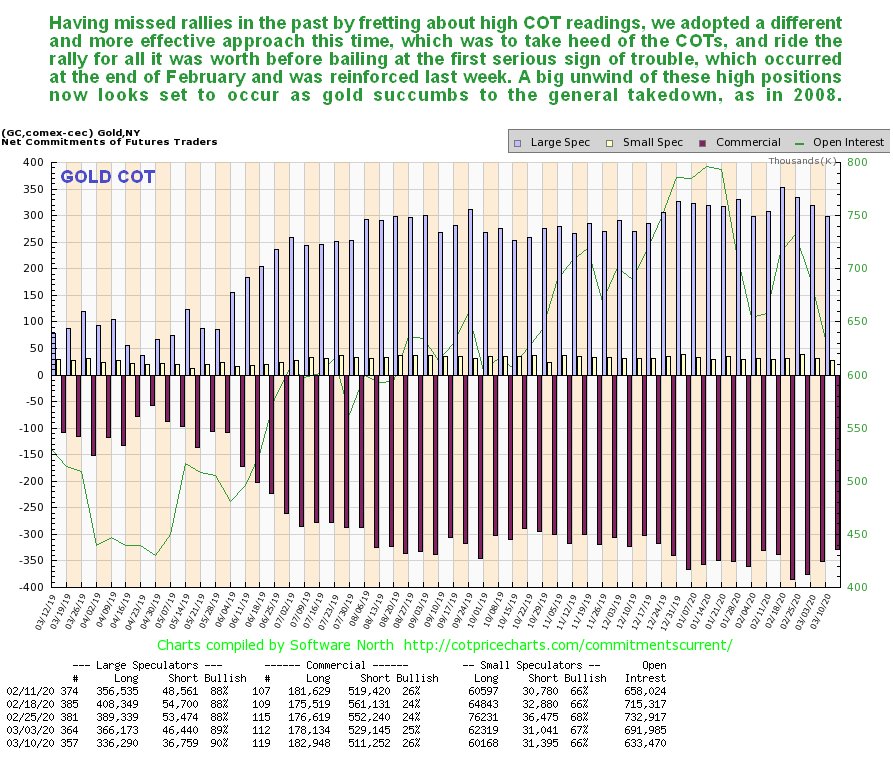
Having missed pretty sizeable rallies in gold in the past as a result of being deterred by extreme COT readings, we this time adopted a different and as it turned out more effective approach, which was to ride the rally for all it was worthwhile taking heed of the COT, and then to bail at the first sign of serious trouble, which occurred towards the end of February as detailed above, prompting the bearish Gold Market update posted on the 1st and the call for a sector-wide drop posted on the site on the 8th, the day before gold hit its final high for the advance. Actually we did more than just bail, going for Put options in GLD (NYSE:GLD), in which one subscriber made enough to pay his subscription to the site for the next 300 years.
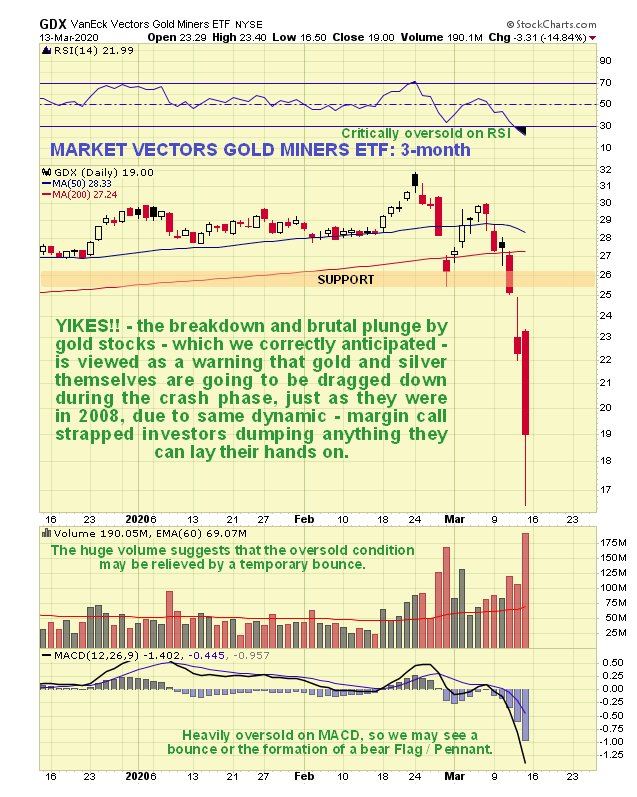
As mentioned above, PM stocks cratered last week, which is a very bearish omen for gold. So what happened? – let’s quickly review the latest most relevant charts.
On the 3-month chart for GDX we can see that it went into freefall after key support at $25.50 failed, with the huge daily range and very heavy volume on Friday a sign of a selling climax and a temporary bottom. However, after consolidating this drop, perhaps by forming a countertrend bear Flag over the near-term, renewed decline to new lows is expected.
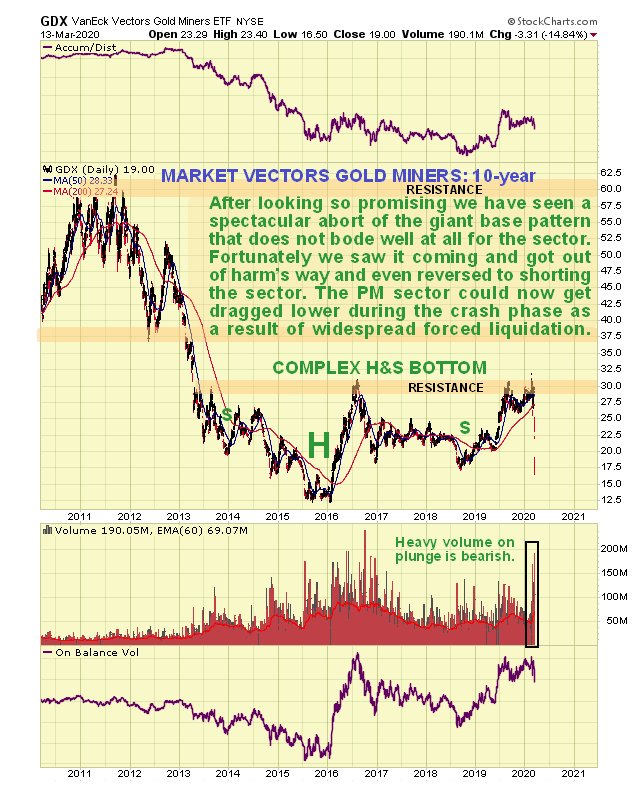
Just how serious this precipitous drop in GDX was we can see on its 10-year chart, which shows that it has already crashed support at its 2018 lows, in the process wrecking and aborting the hitherto promising pattern, which had looked like a giant base pattern. This chart as “Game over” written all over it.
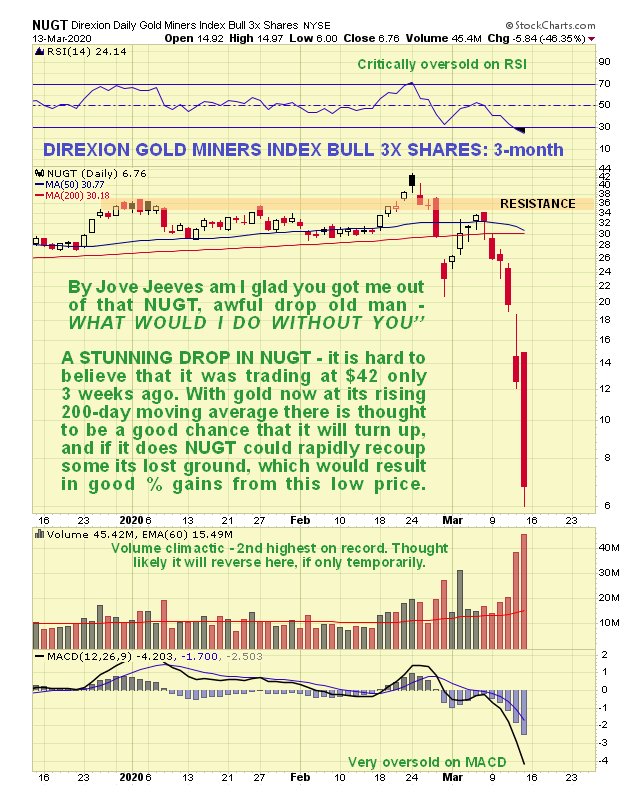
The bearish implications of the collapse in PM stocks last week is emphasized even more by the ruinous drop in some leveraged stock bull ETFs, like NUGT shown below, which went straight over a cliff. It is now so cheap that it is believed to have thrown up a profitable opportunity since their a good chance of a snapback rally that will result in significant percentage gains, after which it is likely to drop back again.
One reason for gold finally caving in last week is the extraordinarily sharp rally in the dollar followed a steep drop to hit our downside trendline target that we had earlier delineated.
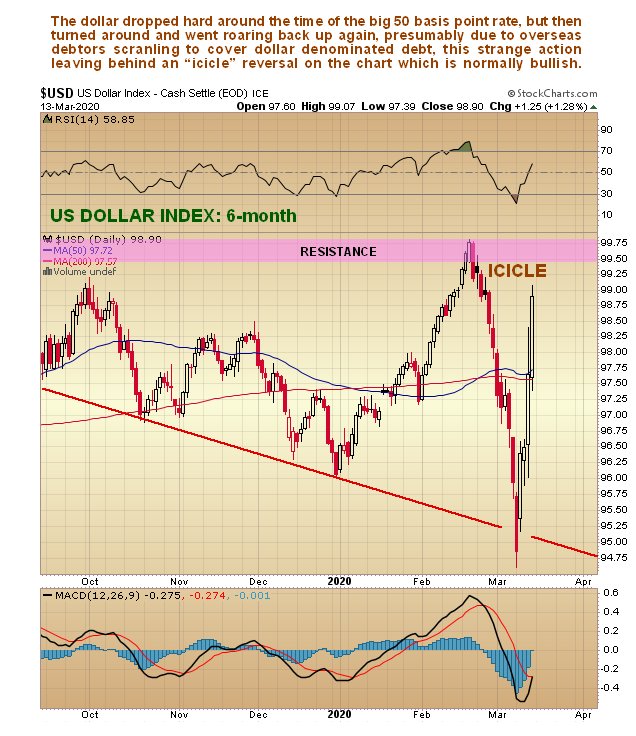
What seems to be happening with the dollar is that the drop due to the big rate cut has been reversed due to the global market meltdown leading to a clamor for dollars as overseas holders of dollar-denominated debt scramble to cover their positions.
