⏳ Final hours! Save up to 60% OFF InvestingProCLAIM SALE

Gold Market Update: Bullish Big Picture

Published 07/22/2019, 06:41 AM
Updated 07/09/2023, 06:31 AM
XAU/USD
-
GC
-
GDX
-

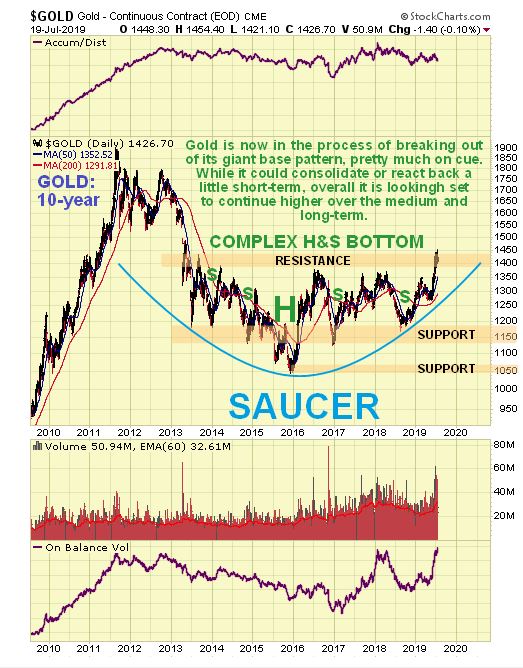
It’s a case of “so far so good” for gold, which is breaking out on schedule from its giant complex Head-and-Shoulders base that may also be classified as a Saucer base, as can be seen on its latest 10-year chart.
Gold 10-Year Chart

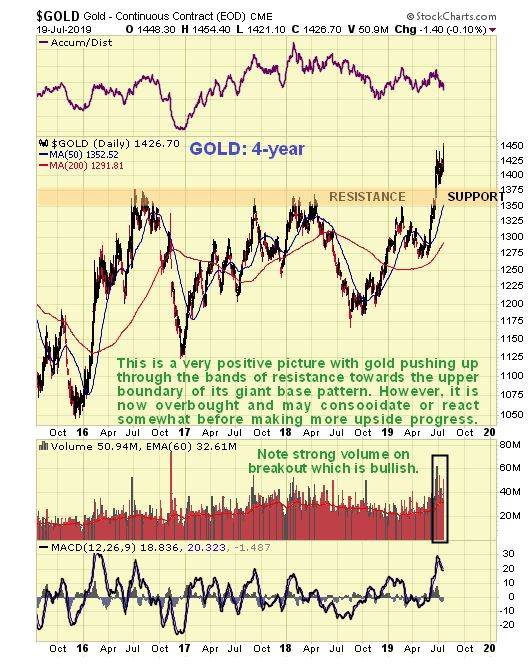
On the 4-year chart, we can see that gold’s breakout move last month has resulted in it becoming overbought, which partly explains why it hasn’t gone anywhere in recent weeks. This is normal following a breakout and it could react back to about $1375 before the advance resumes.
Gold 4-Year Chart

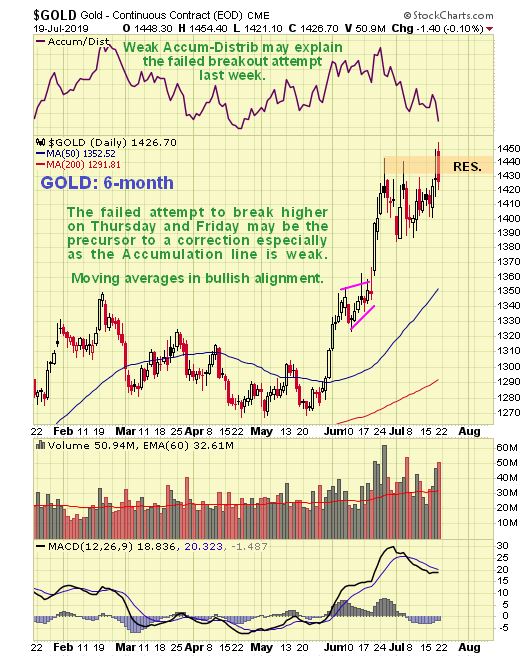
On the latest 6-month chart we can see that recent price/volume action increases the risk of a near-term reaction, because gold has tried twice to break out of a possible bull Flag / Pennant, on Thursday and Friday, and failed, with this failure (thus far at least) made more likely and perhaps presaged by the weak Accumulation line. A failed Pennant breakout usually leads to a period of retreat.
Gold 6-Month Chart

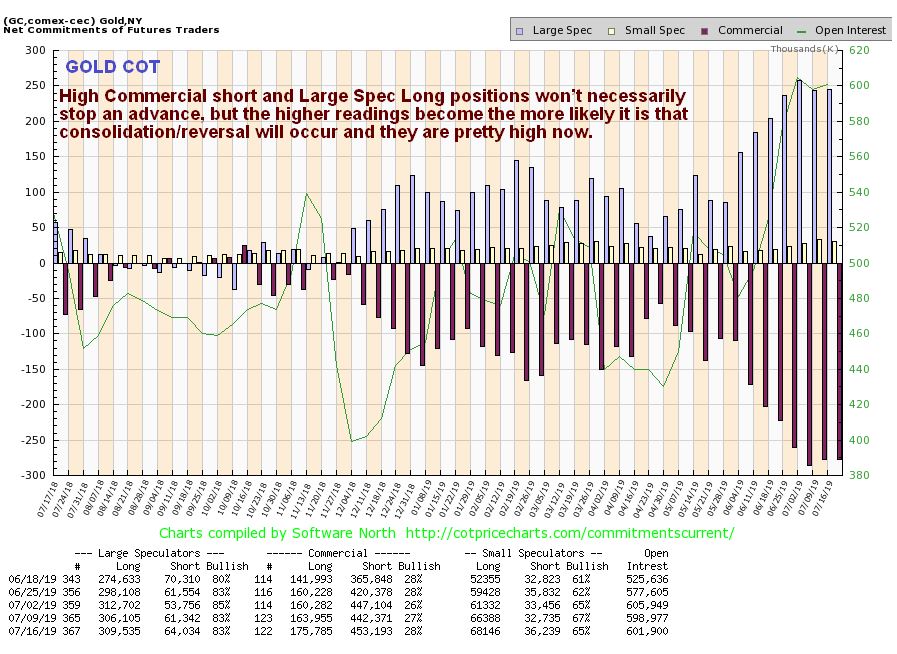
While gold’s latest COT readings do not preclude further advance, it is clear that it would benefit from an easing of current Commercial short and Large Spec long positions which are rather extreme and increase the chances of some sort of reaction here.
Gold’s Latest COT Readings

So, the big picture is strongly bullish, but, barring the Iran situation dramatically worsening, it looks like a period of consolidation /reaction is likely before further significant gains are made. If gold and the sector do react, it is considered unlikely that it will be by much and any such reaction may be used to add to positions across the sector.

It was rather odd late last week that while gold tried to break higher but failed to, the PM sector forged ahead on Wednesday and Thursday, as we can see on the latest 6-month chart for GDX (NYSE:GDX). Normally, stocks rallying leads to gold following suit, but gold’s price/volume action was not bullish for the near-term, and nor was the action in GDX on Friday, which saw a bearish Harami pattern appear, which is where a large candle the previous day is followed by a small one which fits inside the 1st one This is bearish and usually marks a reversal, and thus probably marks the start of a corrective phase.
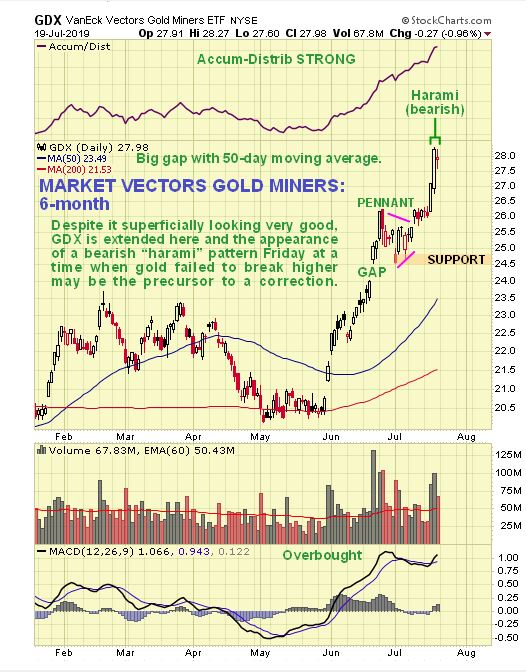
GDX 6 Month Chart

Original Post

Latest comments

Loading next article…
Risk Disclosure: Trading in financial instruments and/or cryptocurrencies involves high risks including the risk of losing some, or all, of your investment amount, and may not be suitable for all investors. Prices of cryptocurrencies are extremely volatile and may be affected by external factors such as financial, regulatory or political events. Trading on margin increases the financial risks.
Before deciding to trade in financial instrument or cryptocurrencies you should be fully informed of the risks and costs associated with trading the financial markets, carefully consider your investment objectives, level of experience, and risk appetite, and seek professional advice where needed.
Fusion Media would like to remind you that the data contained in this website is not necessarily real-time nor accurate. The data and prices on the website are not necessarily provided by any market or exchange, but may be provided by market makers, and so prices may not be accurate and may differ from the actual price at any given market, meaning prices are indicative and not appropriate for trading purposes. Fusion Media and any provider of the data contained in this website will not accept liability for any loss or damage as a result of your trading, or your reliance on the information contained within this website.
It is prohibited to use, store, reproduce, display, modify, transmit or distribute the data contained in this website without the explicit prior written permission of Fusion Media and/or the data provider. All intellectual property rights are reserved by the providers and/or the exchange providing the data contained in this website.
Fusion Media may be compensated by the advertisers that appear on the website, based on your interaction with the advertisements or advertisers.
© 2007-2024 - Fusion Media Limited. All Rights Reserved.