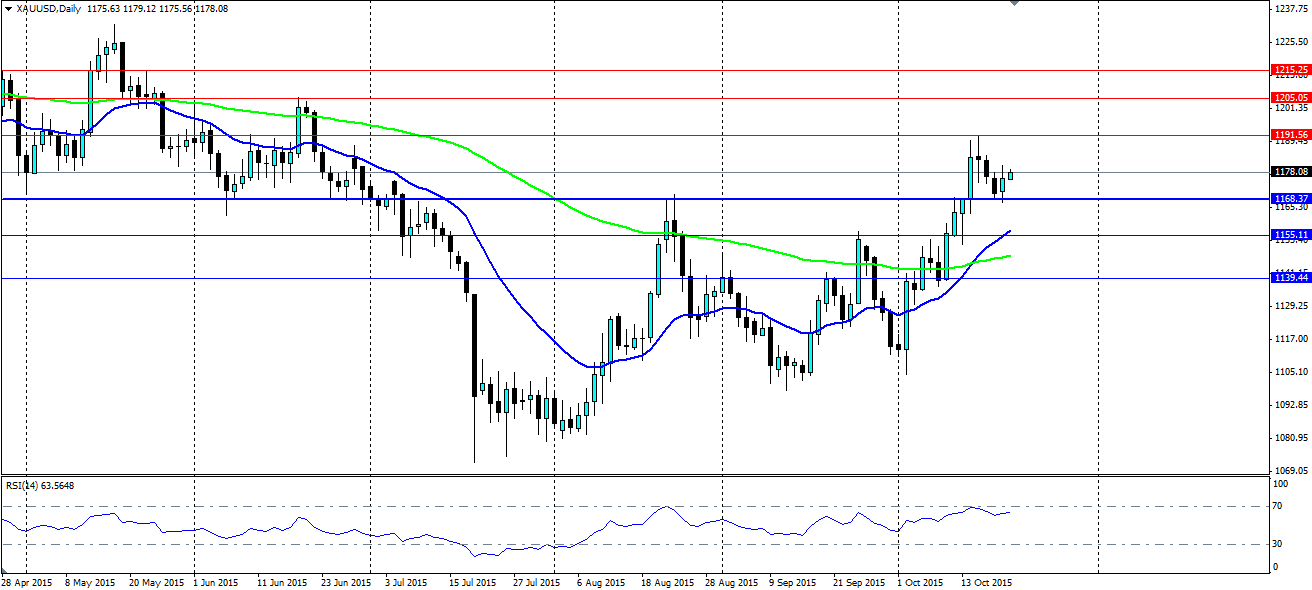
Gold has made some solid gains over the past few weeks as the market begins to doubt if we will see a rate rise from the Fed this year. A break through of a solid resistance level, and a pull back to it signals the market is looking to take gold through the recent four month high.
Gold has seen plenty of demand thanks to a series of mixed economic data sets that have many market participants questioning whether the Fed will be able to justify a rate rise in 2015. Last week the poor US core retail sales figures at -0.3% m/m (0.1% prev) highlights the uncertainty in the US consumer sector, which generally underpins the US economy. At the same time the PPI result was released and added to the upward pressure on gold as it came in at -0.5% m/m, down from 0.0%.
Earlier this month we heard from Federal Reserve Vice Chairman Stanley Fischer whose rhetoric is slightly changing when it comes to interest rates. His stance is now that a rate rise in 2015 is an “expectation, not a commitment”. In other words, the Fed would like to raise rates but does not have the data to do so. The market agrees and Gold has been bid higher on expectation of lower interest rates for longer.
Mr Fischer also pointed to weakness in the labour market, noting that real wage growth remains subdued and hiring has slowed over the past two months. Certainly the issue of low inflation is causing headaches for the Fed, but to the benefit of the gold price. The Fed meeting on 27th October will be one to watch, with at least one FOMC member suggesting this was still a “live” meeting and that a hike was “possible”. That being said, it will be difficult for the Fed to justify a hike in October, if they could not hike in September, so expect more of the same.

The daily chart for gold shows clearly the turnaround in sentiment. For the first time since January, the 100 day MA has turned positive, and a cross of the 20 MA over it certainly signals to the market the direction of the sentiment. The key level of indication is the now support at $1168.37. This is a level that has acted as a swing point several times in the past and was clearly a point of interest in the recent bullish leg.
This week, the price has pulled back to it and used it as support, which the bulls defended with ease. That signals another bullish leg is ready to begin which will see the recent four month high at $1191.44 come under pressure. The RSI edged up close to the oversold level, however the recent pull back ensures there is still enough upside potential in the RSI for any test of the highs.
Any leg higher will look for resistance at the recent high at $1191.56 with further resistance at $1205.05 and $1215.25. If the support at 1168.37 fails, look for the next levels of support at $1155.11 and $1139.44.
