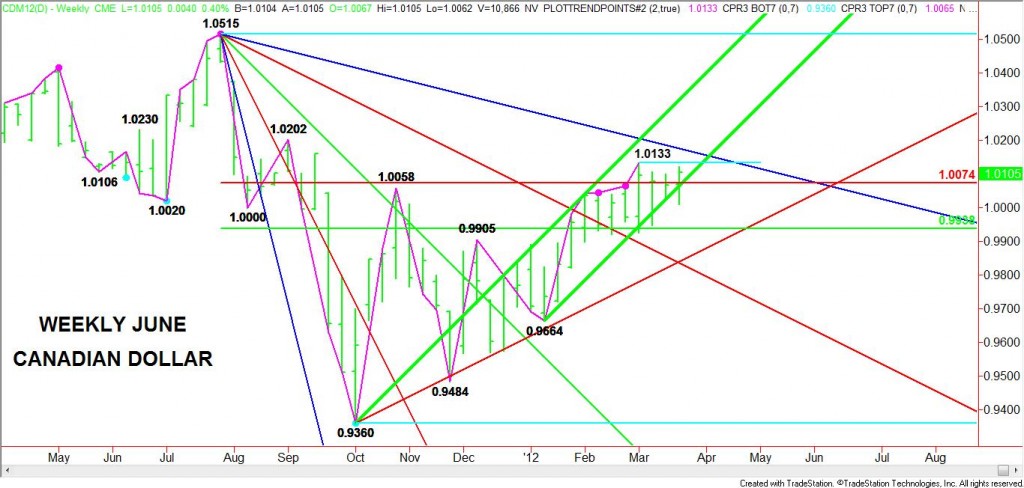
The strong turnaround in the June Canadian Dollar has put the market in a strong position to breakout to the upside on the weekly chart. After posting an expanded range four weeks ago and topping at 1.0133, the Canadian Dollar has since held two tests of a major 50 percent price level at .9938 while trying to establish support on an uptrending Gann angle at 1.0064 this week.
The current chart pattern suggests that the Canadian Dollar could breakout through the March 1 top at 1.0133, but is likely to run into some resistance at the downtrending Gann angle at 1.0175. Once this level is cleared the next likely upside target will be September 1, 2011 top at 1.0202.
Based on the main range of 1.0515 to .9360, a key retracement zone has been established at .9938 to 1.0074. Crossing over to the bullish side of this zone will be a sign of strength and a resumption of the uptrend which is why bullish and bearish traders have been battling for several weeks since this zone was first tested.
The important levels to watch are 1.0064 and 1.0074. This is basically a crossing of a diagonal line (an uptrending Gann angle) and a horizontal line (retracement level). Now that the market has crossed to the bullish side of these two points, an important support cluster has formed. This cluster is controlling the short-term direction of the market. As long as this area holds as support, buyers are likely to try to drive the market higher. A failure to hold this zone late in the week could lead to a collapse in the market.
The Canadian Dollar has been trading sideways-to-lower since gold topped and began to sell-off. Now that gold is setting up for a volatile move, Canadian Dollar traders should brace for the same type of trading activity. A breakout to the upside in gold is likely to trigger a similar move in the Canadian Dollar.
- English (UK)
- English (India)
- English (Canada)
- English (Australia)
- English (South Africa)
- English (Philippines)
- English (Nigeria)
- Deutsch
- Español (España)
- Español (México)
- Français
- Italiano
- Nederlands
- Português (Portugal)
- Polski
- Português (Brasil)
- Русский
- Türkçe
- العربية
- Ελληνικά
- Svenska
- Suomi
- עברית
- 日本語
- 한국어
- 简体中文
- 繁體中文
- Bahasa Indonesia
- Bahasa Melayu
- ไทย
- Tiếng Việt
- हिंदी
Gold Likely to Dictate Next Move in June Canadian Dollar
Published 03/21/2012, 08:46 AM
Gold Likely to Dictate Next Move in June Canadian Dollar
Latest comments
Loading next article…
Install Our App
Risk Disclosure: Trading in financial instruments and/or cryptocurrencies involves high risks including the risk of losing some, or all, of your investment amount, and may not be suitable for all investors. Prices of cryptocurrencies are extremely volatile and may be affected by external factors such as financial, regulatory or political events. Trading on margin increases the financial risks.
Before deciding to trade in financial instrument or cryptocurrencies you should be fully informed of the risks and costs associated with trading the financial markets, carefully consider your investment objectives, level of experience, and risk appetite, and seek professional advice where needed.
Fusion Media would like to remind you that the data contained in this website is not necessarily real-time nor accurate. The data and prices on the website are not necessarily provided by any market or exchange, but may be provided by market makers, and so prices may not be accurate and may differ from the actual price at any given market, meaning prices are indicative and not appropriate for trading purposes. Fusion Media and any provider of the data contained in this website will not accept liability for any loss or damage as a result of your trading, or your reliance on the information contained within this website.
It is prohibited to use, store, reproduce, display, modify, transmit or distribute the data contained in this website without the explicit prior written permission of Fusion Media and/or the data provider. All intellectual property rights are reserved by the providers and/or the exchange providing the data contained in this website.
Fusion Media may be compensated by the advertisers that appear on the website, based on your interaction with the advertisements or advertisers.
© 2007-2025 - Fusion Media Limited. All Rights Reserved.
