Yesterday, we wrote the following regarding the USD Index chart:
The move below the mid-August low in the USD Index is a very recent and likely a very temporary development. Let's keep in mind the long-term USD Index chart. Combining the above with the - more important - long-term picture, it seems likely that the USDX will invalidate the breakdown shortly.
Remember when in early 2018, we wrote that the USD Index was bottoming due to a very powerful combination of support levels? Practically nobody wanted to read that as everyone "knew" that the USD Index is going to fall below 80. We were notified that people were hating on us in some blog comments for disclosing our opinion - that the USD Index was bottoming, and gold was topping. People were very unhappy with us writing that day after day, even though the USD Index refused to soar, and gold was not declining.
Well, it's the same right now.
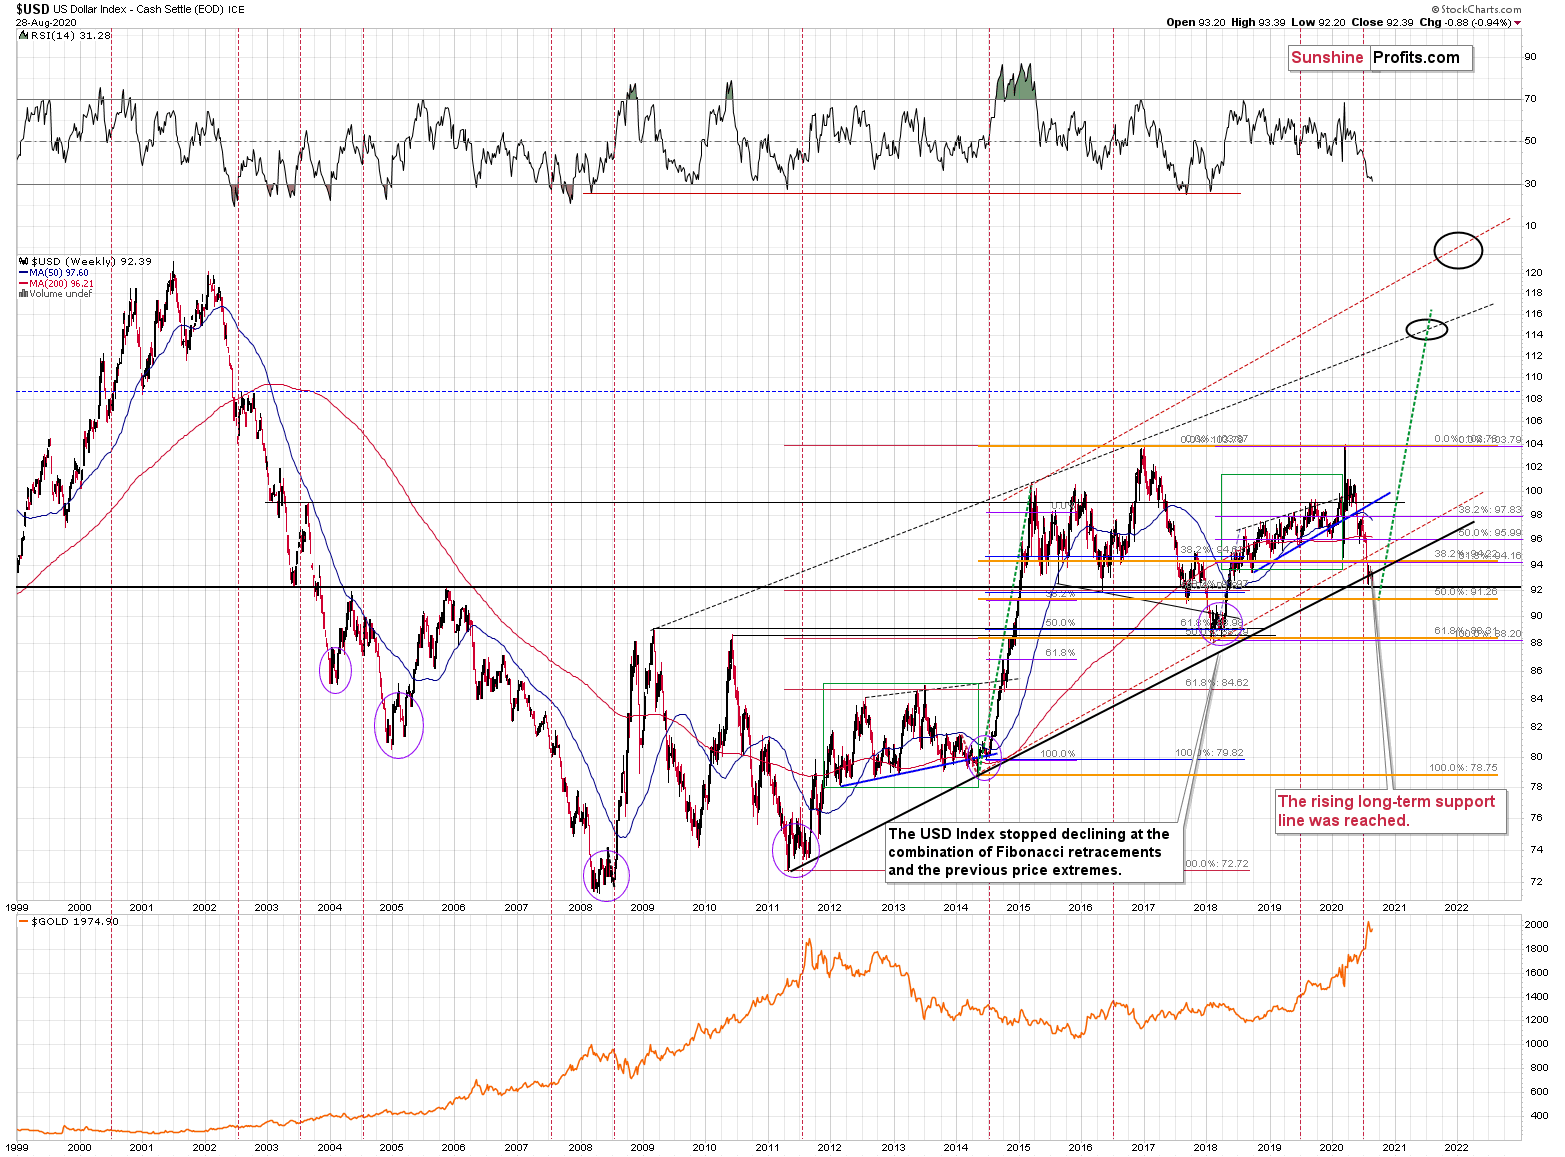
The USD Index is at a powerful combination of support levels. One of them is the rising, long-term, black support line that's based on the 2011 and 2014 bottoms.
The other major, long-term factor is the proximity to the 92 level - that's when gold topped in 2004, 2005, and where it - approximately - bottomed in 2015, and 2016.
The USDX just moved to these profound support levels, and it's very oversold on a short-term basis. It all happened in the middle of the year, which is when the USDX formed major bottoms on many occasions. This makes a short-term rally here very likely.
While it might not be visible at the first sight (you can click on the chart to enlarge it), the USD Index moved briefly below the long-term, black support line and then it invalidated this breakdown before the end of the week. This is a very bullish indication for the next few weeks.
Based on the most recent price moves, the USDX is once again below the above-mentioned strong rising support line, but we doubt that this breakdown would hold. We expect to see an invalidation thereof that is followed by a rally.
Please note that the major bottoms in the USD Index that formed in the middle of previous years often took form of broad bottoms. Consequently, the current back and forth trading is not that surprising. This includes the 2008, 2011, and 2018 bottoms.
And that's what followed:

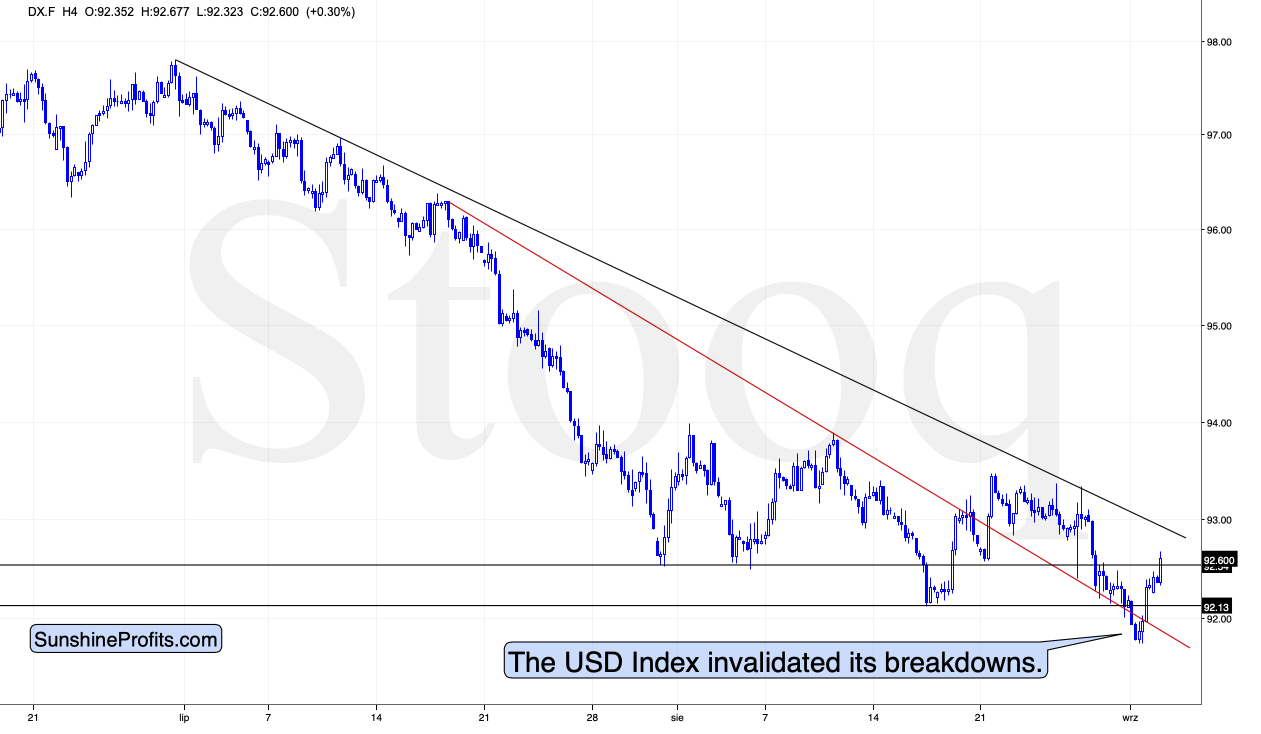
The USD Index invalidated all short-term breakdowns:
- Below the mid-August low
- Below the late-July and early-August lows
- Below the declining red support line
The implications of these invalidations are very bullish, especially that we saw this show of USDX's resilience right after series of bearish news, for instance in the form of the dovish change in the Fed's approach.
The bullish implications for the USD Index are bearish for the precious metals sector.
Yesterday, we reported the following about gold:
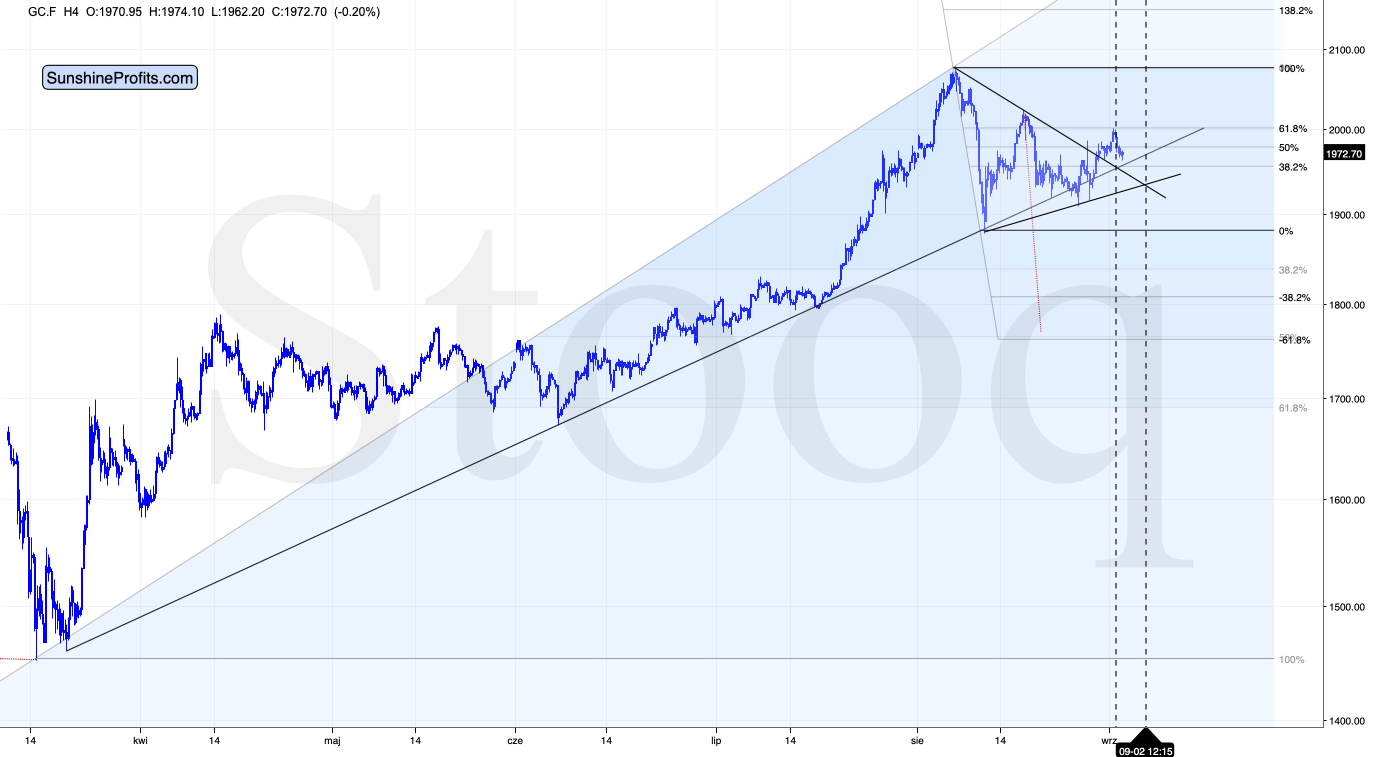
Still, the more important (based on a more profound move - the early-August decline) 61.8% Fibonacci retracement was just reached, without being broken. Consequently, the overnight rally was not as bullish as it may seem at first sight. Moreover, let's keep in mind that gold is just before the first of the triangle-vertex based turning points, which means that it's likely to reverse shortly. Since the preceding move was to the upside, gold is likely just before a top.
And on Monday, we wrote the following:
Also, as you can see on the chart above, there's a vertex-based reversal "scheduled" for the next several days. In fact, there are two such reversals. This means that gold's recent upswing is likely to be reversed rather sooner than later. A tiny move below the previous lows in the USD Index and then its profound invalidation would serve as a perfect trigger for gold's decline.
We saw exactly that.

Gold topped right at the triangle-vertex-based reversal when the USD Index invalidated its breakdowns. It also happened at the 61.8% Fibonacci retracement.
The final top in gold is most likely in, and we expect the yellow metal to slide shortly. The confirmation of the breakdown below the rising support line based on the March and June lows will likely serve as the "go!" of the move. What we saw recently is already the "get ready, set" part.

