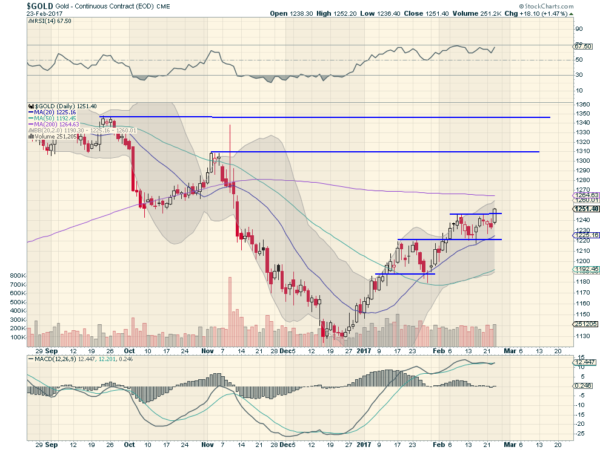
Gold went through a rough period from the election in November through to mid December. It lost over $170 in value, more than 10% before finding a bottom. But since that low it has steadily been working higher. It stalled when it hit 1215 in January and pulled back. The 20-day SMA caught it as support and it started higher again. That move ran up to a new range from 1215 to 1245 where it sat until Thursday.
Gold has been very volatile over the last year. But the latest range-break to the upside sets it up for a major push higher technically. First there is a Measured Move to the upside to 1280 out of the latest range. This will bring the price of gold back over its 200-day SMA for the first time since it started the free fall in November.

The momentum indicators support more upside price action. The RSI is rising in the bullish range while the MACD is high and bullish. Beyond momentum, the Bollinger Bands® are turned to the upside, this allows upward movement from a volatility perspective. It is still early but the 50-day SMA is following the 20-day SMA higher now, but still at least a month from a Golden Cross, moving up through the 200-day SMA.
The next important price level for Gold comes at that 200-day SMA. A close over that and hold there for significant time, or just continuation through it like it was not there, is a bullish signal for long term investors. The 1310 high from November would be the next significant level and finally the September high at 1345. If Gold can keep moving higher through these levels the long downtrend may be over and it could be ready to blast off for some significant upside.
The information in this blog post represents my own opinions and does not contain a recommendation for any particular security or investment. I or my affiliates may hold positions or other interests in securities mentioned in the Blog, please see my Disclaimer page for my full disclaimer.
