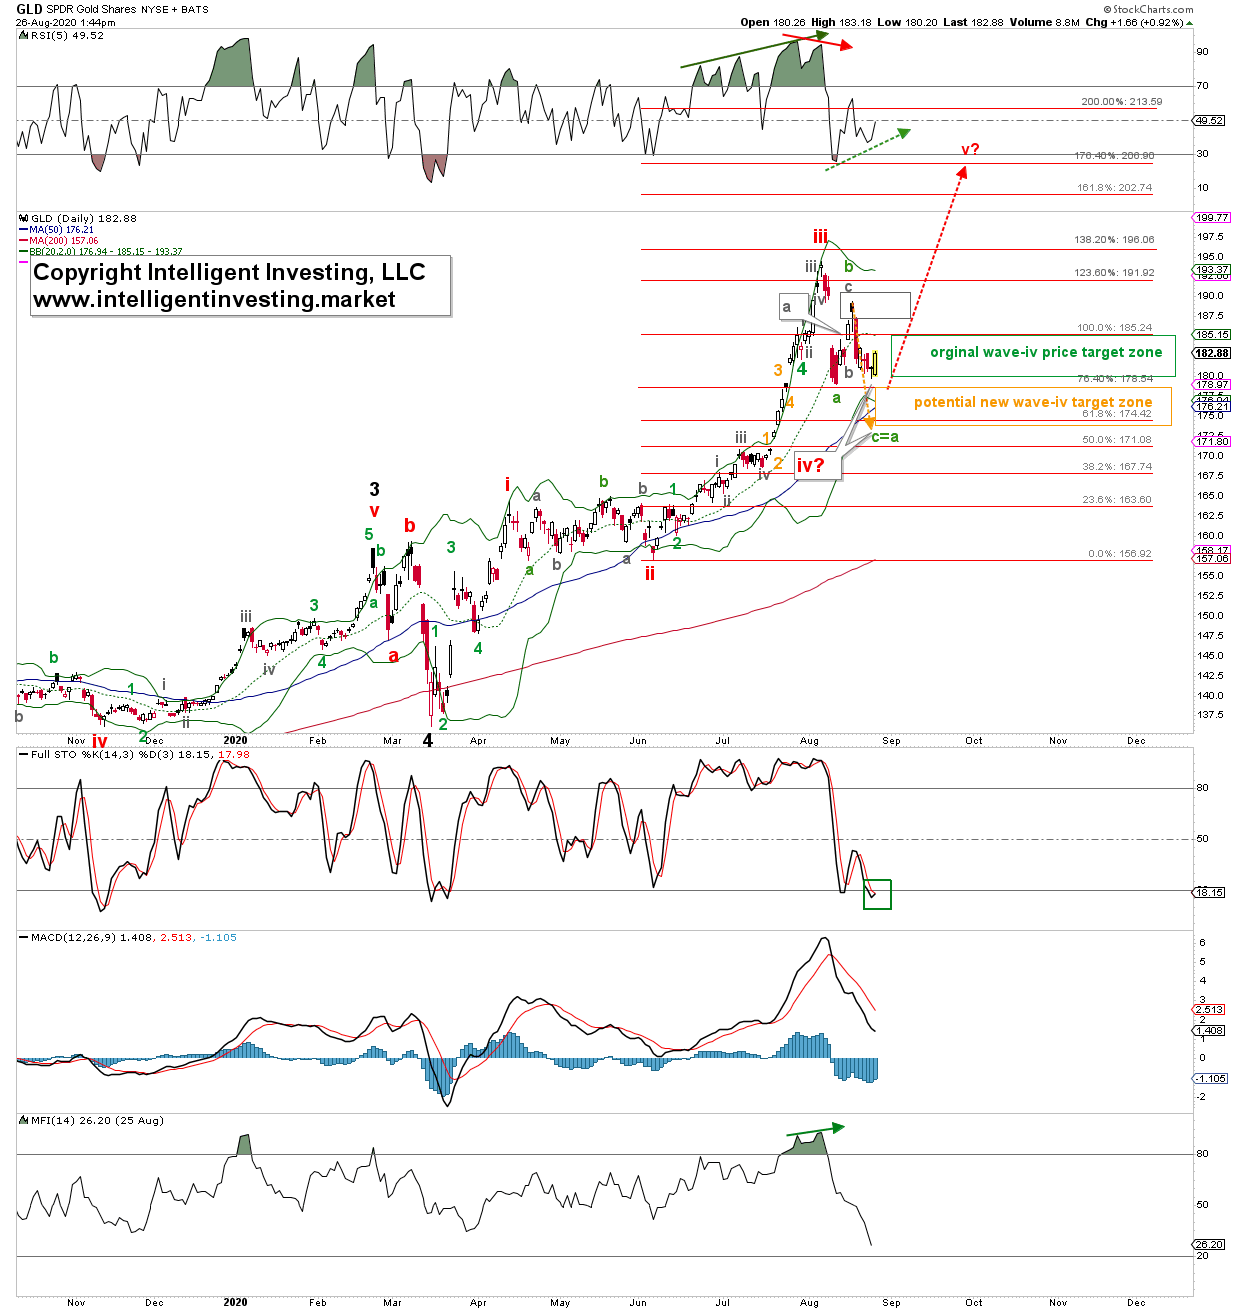
Over the past three weeks, I have kept you updated on the progress of the Gold-related Exchange Traded Fund (NYSE:GLD) using the Elliott Wave Principle. (See my articles here, here, and here.)
Last week I wrote:
“Using EWP, I can determine that either (red) wave-v is under way to ideally $206, or that (red) wave-iv is becoming a more complex correction. See Figure 1 below.
Corrections are always of a, at least, three-wave nature: a, b, c, and the recent low could have been (green) wave-a of iv, the current high wave-b (green b) of wave-iv, and now [green] wave-c of [red] iv is under way. The green box is my original (red) wave-iv target zone. GLD bottomed in it perfectly and rallied as anticipated. But, … I am concerned the lower (orange) target zone at $178.50-174 will become operable, as GLD appears to be in green “c” with an ideal c=a target at $174ish. So let’s see how GLD will move over the next few days and if this new target zone can be reached. I, for one, will long GLD again when this price region is reached, with the appropriate stops as usual in place because I know I am always wrong till proven right by the market.”
Figure 1. GLD daily candlestick chart with EWP count.

The past week, I let the market make its move, and it told me red wave-iv became more complex, and so far, a nice three-wave “a, b, c” structure developed for wave-iv. This pattern was my preferred POV. But please know what I prefer is not what the market always will do. Regardless, GLD is right back at the lower end of the original wave-iv target zone, and it is, so far, putting in a strong candle today. There’s positive divergence (dotted green arrow) on the daily RSI5, which is often a good sign for a more sustained rally. The FSTO indicator is also trying to give a buy crossover today (green box). Only the MACD and Money Flow Index are still on a sell. Besides, price is still below its 20-day Simple Moving Average (SMA), but above its 50-d and 200-d SMAs. Thus, the short-term trend is still down, while the intermediate- to long-term trends are still up.
Bottom line: The glass is starting to fill back up in favor of the bulls. As long as yesterday’s low at $179.73 holds, GLD can move higher. A close back above the 20-d SMA will add further weight to the evidence red wave-v to ideally around $207 is under way. A close below yesterday’s low will ideally target the c=a extension at around $174ish. Thus, at this stage, there is an approximate 1.5-2% downside risk and a 13% upside reward set up for a long trade, which I will take. Yes, I put my money where my mouth is.
Now, if wave-iv bottoms here, then wave-c of wave-iv did not reach its full potential. This “truncation” often happens in a bull market: downside disappoints and upside surprises. That is why all one can do is 1) anticipate (c=a), 2) monitor (will wave-c become equal to the length of wave-a? It doesn’t have to!), and 3) adjust if necessary. A flexible, open-mind is required to analyze and trade the markets well.
