Finally, 2014 is done.
It was a tough year in many regards and markets were definitely one of them.
The metals also had a tough year and they do still look set to continue to struggle.
Markets and stocks remain in a bull market and I expect 2015 to be a great year trading today's leading sectors, and those who emerge as the year plays out.
Markets are now correcting and this correction should be short-lived again, and we should get a buy signal next week as traders return from a nice holiday.
As markets and leading stocks bottom and begin to move back higher next week, gold and silver should break lower.
I enjoyed some needed time away from writing over the holidays but I still spent my time in front of the screens watching, although I didn’t do too much trading.
Soon enough, we should be heavy into stocks again.
I hope you all enjoyed your holidays and are refreshed and ready to go next week as volume begins to come back.
Let’s take a look at the precious metals as we kick off 2015, which will be a stunning year, I think!

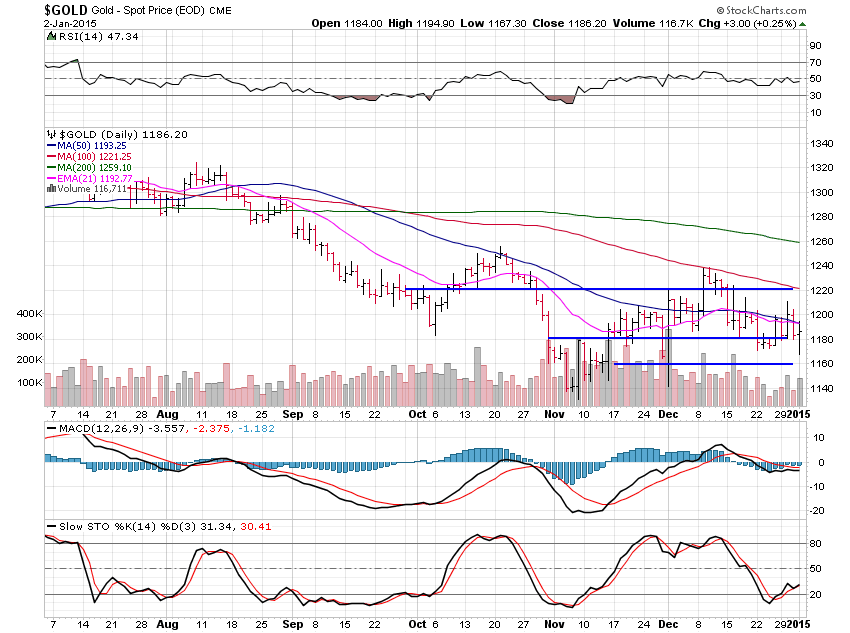
Gold lost 0.83% during the holiday shortened week and remains in a range between $1,180 and $1,220.
Many people are being whipsawed in this whippy action at least on an emotional level.
Sometimes you’ve just got to step back and look at the daily chart and the big picture.
Wide and loose action as we’ve been seeing is rarely good.
Usually the next break is lower and it will come next week most likely.
One point I’ve tried to hammer home with subscribers during the holidays is that gold does tend to be pushed around or manipulated to some degree and that is much easier to do when traders are on holidays so that is part of the reason why we’ve seen such wide action lately.
The other reason is that the chart is bearish and pointing to lower prices.

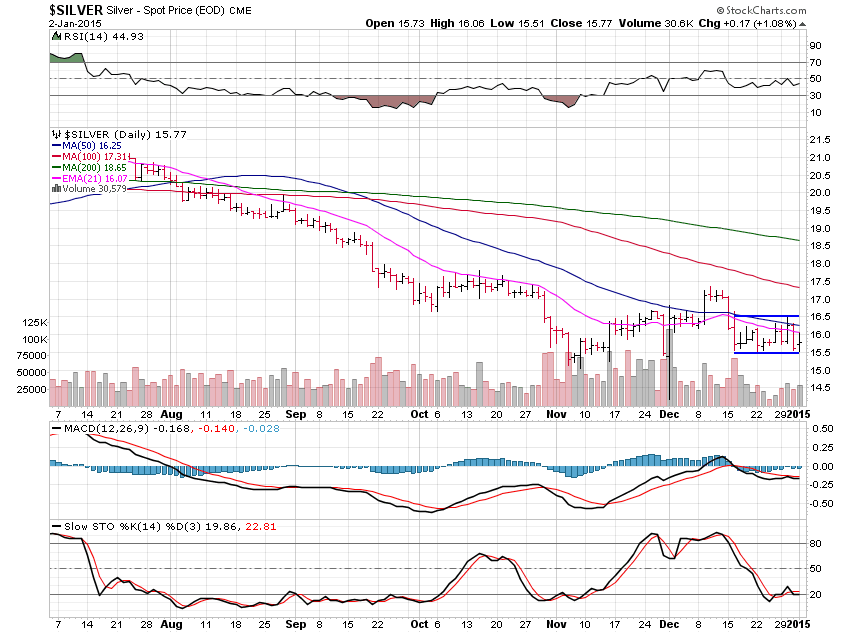
Silver lost 0.32% as it also remains in a range that points to a move lower soon.
$16.50 is the top end while $15.50 is the lower end of this range.
You could also call this a head and shoulders pattern although it isn’t perfect; but still, this chart screams lower to me.
Trying to trade a range isn’t always easy or worth it but you can trade off those two levels if you are looking for small gains.

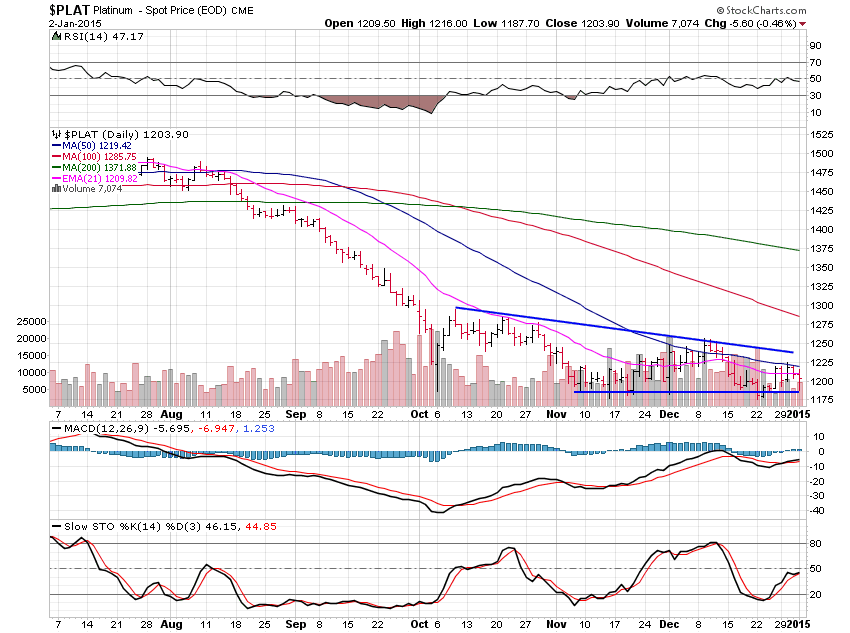
Platinum fell 1.06% for the week and is also looking to move lower.
This triangle is a continuation pattern and the trend is obviously down.
Keep it simple and you’ll do fine.
It’s the thinking that gets you into trouble usually, so I try to just react without thinking too much about the why’s.

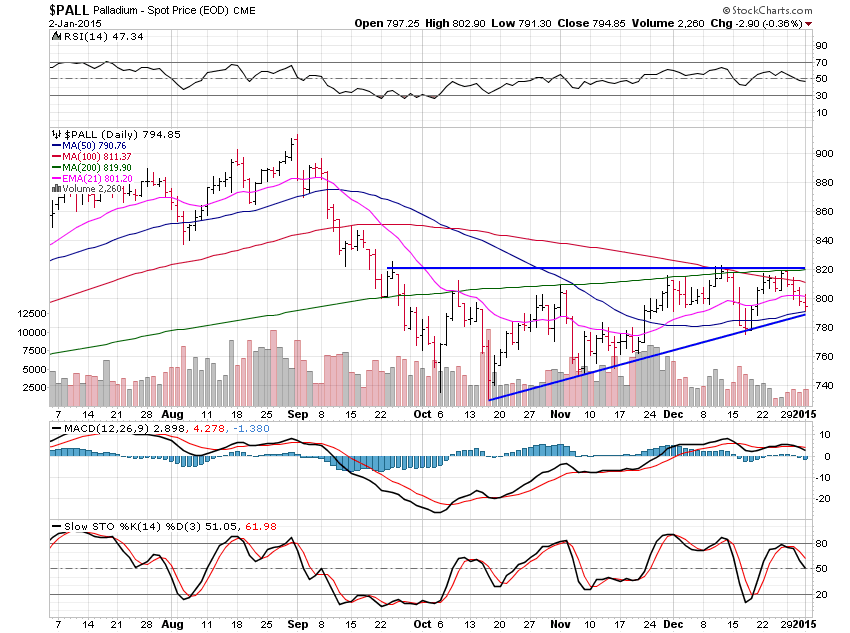
Palladium fell 2.75% in the short week.
This triangle is a continuation pattern and should soon see a break lower under the $790 area.
Support is the $760 area but that should quickly be broken.
While markets and leading stocks look great and set for a nice buying opportunity in the weeks and months ahead, precious metals do not.