Is the gold-price reaction over?
Well, since the rally began in the $1170 area, corrections have not lasted very long.
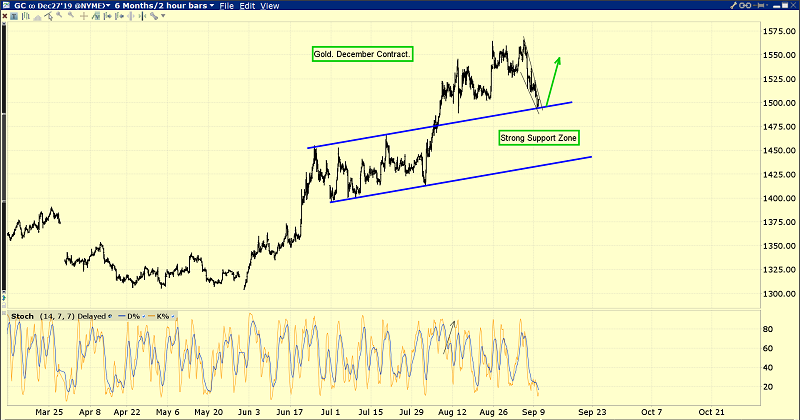
After rallying to the $1566 area, gold has pulled back to about $1500. Strong trend line support is already in play.
Investors need to keep an open mind; it’s possible that the $1500 area is now support rather than resistance, and gold is set to rally towards the $1600-$1700 area.
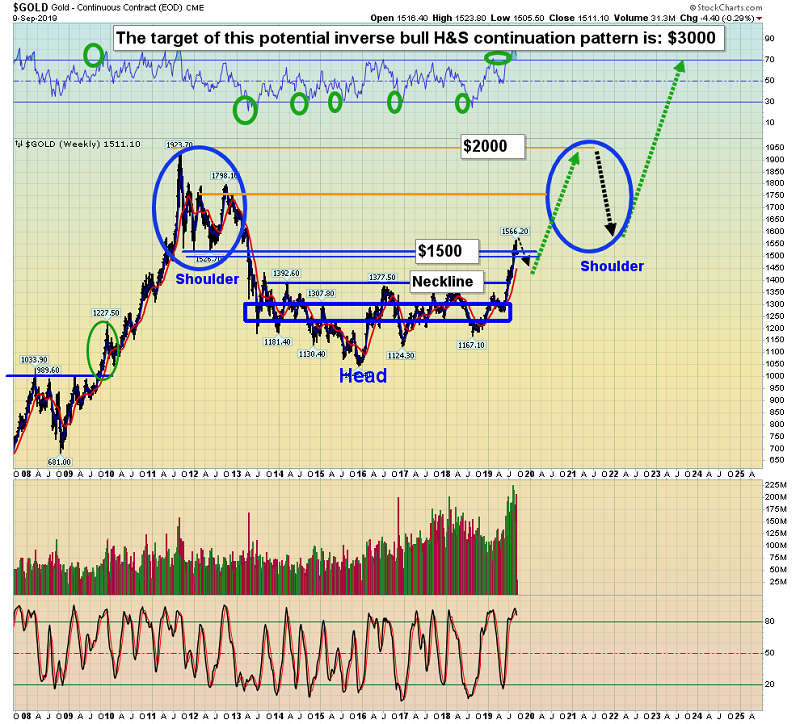
Note the lows in the $1526 area in the 2011-2012 timeframe.
Those lows may now be functioning as support as gold reacts from the $1566 area highs. Also, $1500 is a key round number that may now be functioning as support rather than resistance for institutional money managers.
Indian festival buying may be picking up as well. Indians have been waiting for a decent pullback for months, and now it is here.
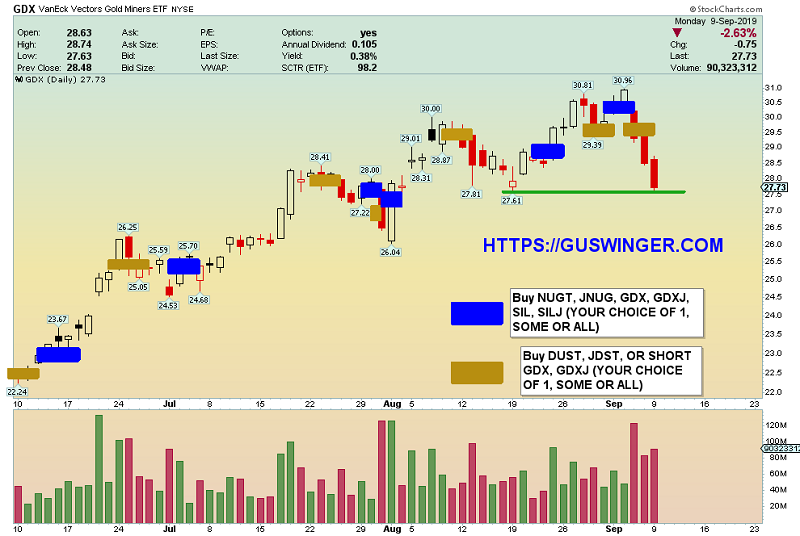
This is the GDX (NYSE:GDX) swing trade chart.
I recommend that most gold investors should consider allocating some capital to a swing trade program.
My guswinger.com system has been in Direxion Daily Gold Miners Bear 3X Shares (NYSE:DUST)-NYSE as GDX (NYSE:GDX) has been “spanked” and it’s now time to book solid profit on at least a portion of the position.
Note the key low on the GDX (NYSE:GDX) chart at $27.61. If it’s violated, GDX could decline to the $26.04 area. Having said that, proper tactics can reduce investor risk dramatically.
My suggestion to core position enthusiasts is to buy some gold stock now, and more if there is a deeper reaction. A stop order can be placed just under the $27.61 low
Investors who don’t like stops can also buy the $27.61 area…with very small size.
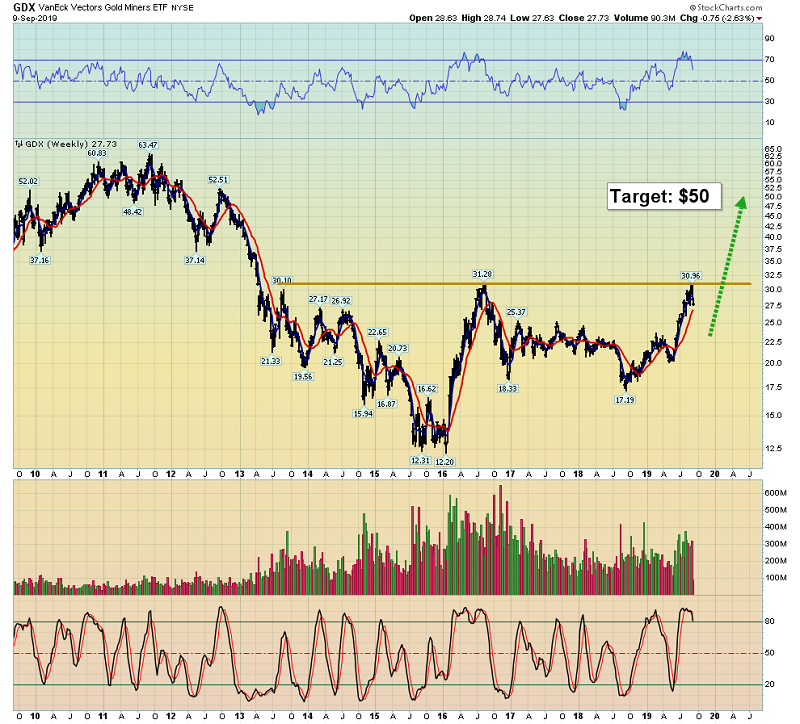
If the inverse H&S bottom on this weekly GDX (NYSE:GDX) chart is legitimate, the current reaction is likely to be very shallow and may already be ending.
The target of the pattern is about $50. The biggest risk investors face now is not drawdowns, but rather missing out on a major run higher in most of the world’s quality miners!
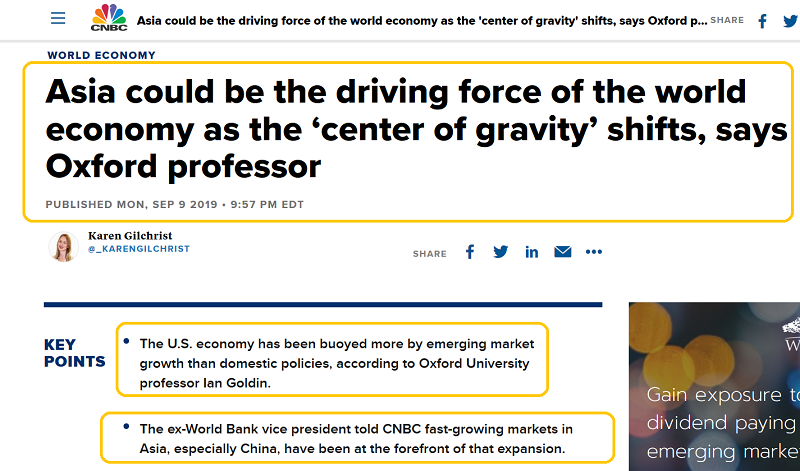
The global economy continues to weaken, and politicians do nothing but spend, borrow, and beg for more QE and negative rates.
That’s pouring gas on the fire. Negative rates and QE incentivize governments to go even deeper into debt.
Please click here now: “In the next credit cycle downturn, then, the generally lower credit quality of today’s speculative-grade population means that the default count could exceed the Great Recession peak of 14% of all rated issuers….” - Christina Padgett, Moody’s VP, Sep 9, 2019.
This is spectacular news for gold!
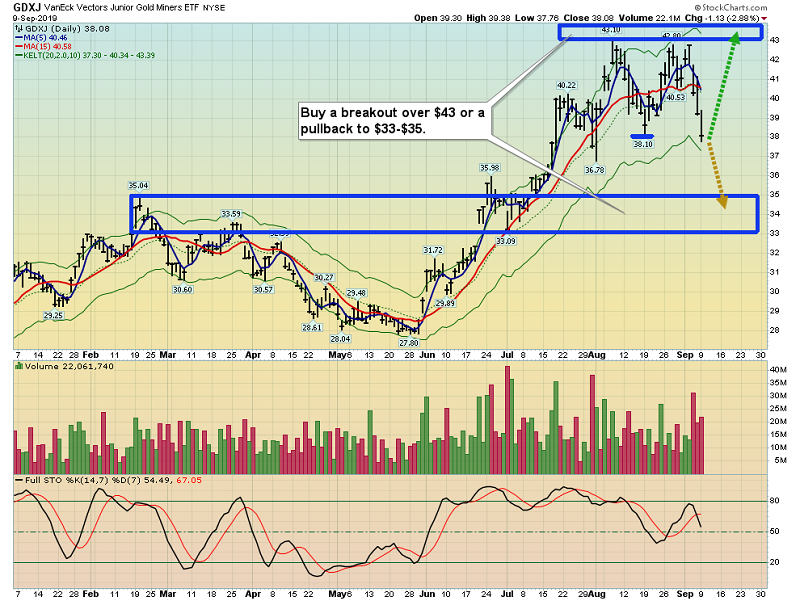
This is the VanEck Vectors Junior Gold Miners (NYSE:GDXJ) chart.
As expected, GDXJ looks a bit more vulnerable than GDX (NYSE:GDX) in the short-term. Having said that, it’s important for investors to be as open to a surge above $43 as to a pullback to $33-$35.
An upside breakout would open the door to a massive run higher, and whether investors pay a “ticket price” of $33 or $43 for their GDXJ ride really doesn’t matter.
The rise of China and India is not going away. The decline of the West is not going away. These forces are destabilizing the dollar and ushering in a bull era for gold, silver and associated miners.
It’s no longer as important to avoid price reactions as it is to stay invested and buy breakouts. As stagflation grows, this gold market will become very similar to the 1970s market… on a much bigger scale!
