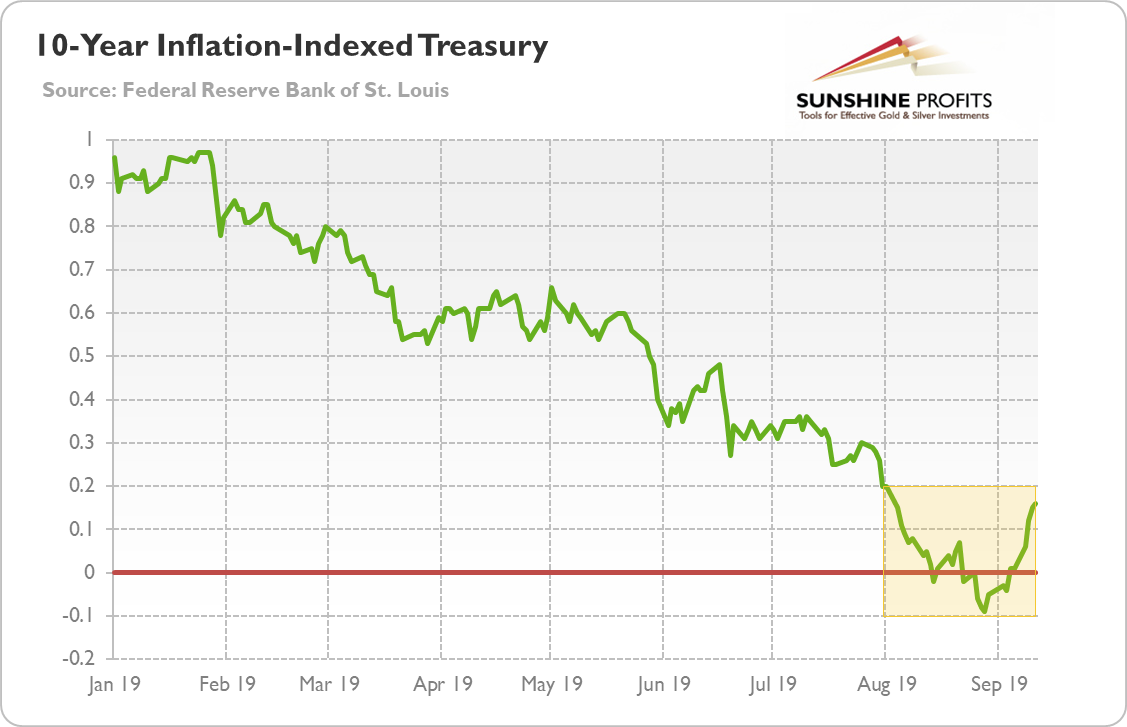
Many people believe that negative interest rates are the ailment of Europe and Japan, and that they will never materialize in the United States. But this is not true. They are already present in America. Can't believe it? Please take a look at the chart below.
Chart 1: Yields on the US 10-Year Inflation-Indexed Treasury in 2019

As one can see, the yield on the U.S. 10-year inflation-indexed Treasury has dived below zero at the turn of August and September. Hence, although nominal interest rates are still positive in America, the real interest rates have turned negative for a while recently. By the way, the chart also shows that the real bond yields have been gradually declining in 2019 until September, which boosted gold prices.
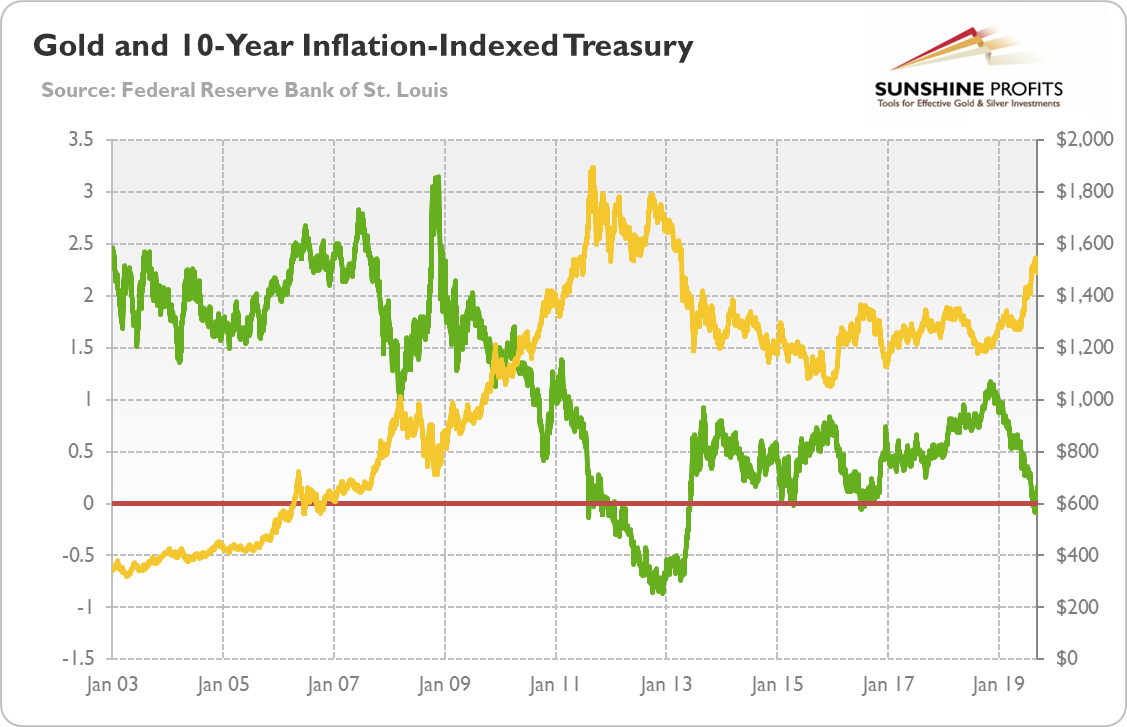
But why is the fall of real interest rates into negative territory so important? Well, more generally, everything that relates to the real interest rates should be of great interest to precious metals investors. This is because of the very strong negative correlation between the real interest rates and gold. It means that the gold prices tend to move in the opposite direction to real interest rates, as it is illustrated by the chart below.
Chart 2: Gold prices (yellow line, right axis, London P.M. Fix, in $) and yields on the US 10-Year Inflation-Indexed Treasury (green line, left axis, in %) from January 2003 to September 2019

More specifically, the previous two times when the 10-year TIPS yield went negative, the price of the yellow metal peaked. Just take one more look at the chart above. Last time when the real interest rates proxy went negative was in July 2016, which coincided with a medium-term peak in the gold prices. This is because the TIPS bottomed and reversed their trend soon after they dipped into negative territory. As real interest rates rallied, the yellow metal struggled.
The second case of the TIPS going negative occurred in August 2011, which coincided with a historical peak in gold prices. Interestingly, the real interest rate continued to trend downward for several months after the gold price peaked. It indicates that either other (perhaps technical) factors prevented the yellow metal from rallying further or that the following slide in the real interest rates was already factored into the gold prices.
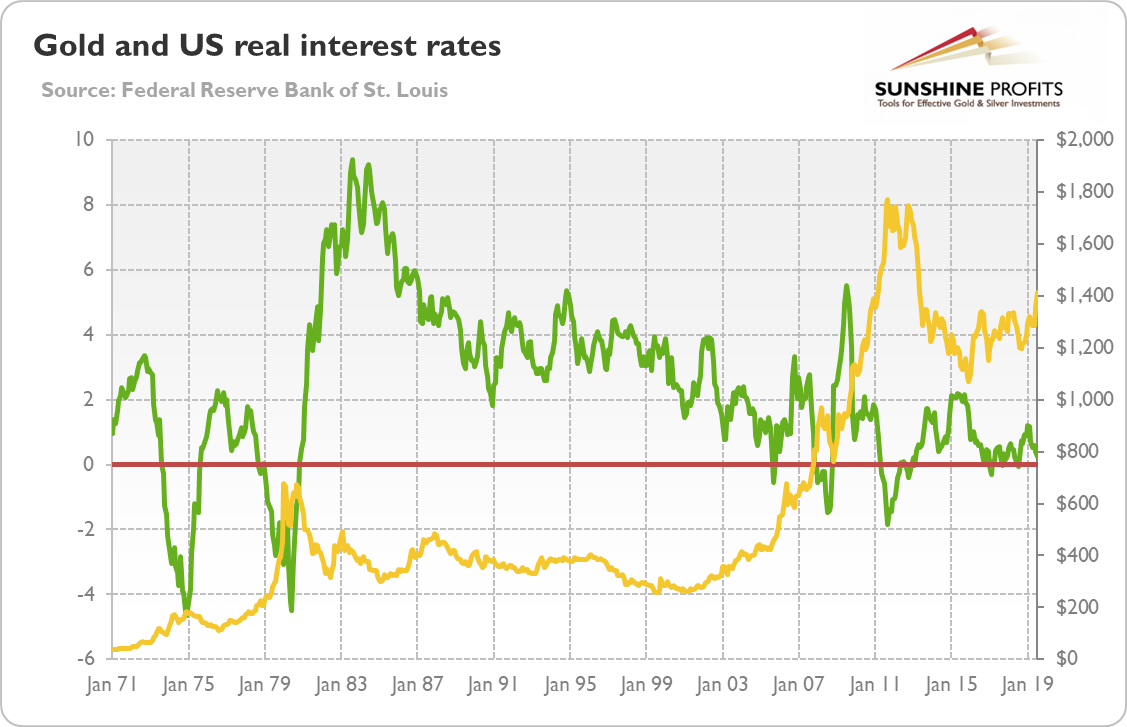
TIPS are a great proxy for real interest rates. However, the data series dates back only to 2003. This is why we constructed another proxy, simply by subtracting the annual percentage change in the CPI from the 10-year Treasury yields. We display it, together with the gold prices, on the chart below.
Chart 3: Gold prices (yellow line, right axis, London P.M. Fix, in $) and the difference between the US 10-Year Treasury yields and CPI annual percentage change (green line, left axis, in %) from January 1971 to July 2019

As one can see, there were two additional periods of negative real long-term interest rates: in 1973-1975 and in 1978-1980. In both cases, the bottoms in real interest rates were caused by high inflation and coincided with peaks in gold prices.
What does it all mean for the future real interest rates path and the gold market? Well, either the real interest rates will rebound, forcing correction in the gold market, or they will continue its downward trend for a while. Given the recent cuts in the federal funds rate and the expected further cuts - perhaps until the yield curve reinverts itself - the latter scenario seems to be more probable.
However, the more dovish central banks and the lower real interest rates could already be priced in the gold market. As it happened in 2011, this is the risk we see currently. Indeed, the sentiment towards gold is very positive right now, as the total speculative net-long position in Comex is very high, which strengthens the view that we could see a correction.
We think that 2019 would be more positive for the yellow metal than 2018. However, that does not rule out ashort-term or medium-term correction. What is important is that the correction should not take years. In recessionary 2008, the real interest rates increased due to the jump in the risk-premium, but from the end of 2008 to the end of 2012, the TIPS remained in the downward trend. Similarly, given that recession is expected to arrive probably next year, the real interest rates may find themselves in the downward trend again. To the benefit of gold.
Disclaimer: Please note that the aim of the above analysis is to discuss the likely long-term impact of the featured phenomenon on the price of gold and this analysis does not indicate (nor does it aim to do so) whether gold is likely to move higher or lower in the short- or medium term. In order to determine the latter, many additional factors need to be considered (i.e. sentiment, chart patterns, cycles, indicators, ratios, self-similar patterns and more) and we are taking them into account (and discussing the short- and medium-term outlook) in our trading alerts.
