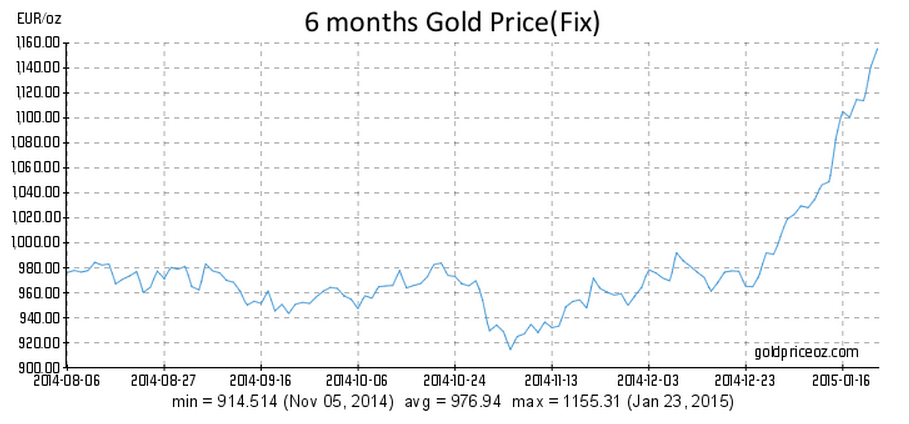
One of the biggest stories of 2015 has been the surging price of gold in euro terms:

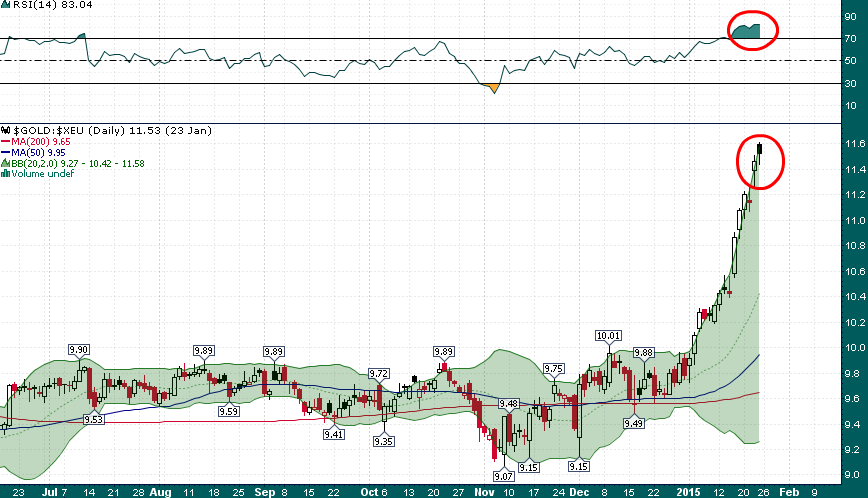
Gold in euro terms has soared nearly 20% in the last month, however, there are mounting signs that a pullback/correction is due:

(Chart of gold priced in USD divided by EUR/USD which equates to the euro price of gold – euro price of gold per ounce can be derived by shifting the decimal place two places to the right)
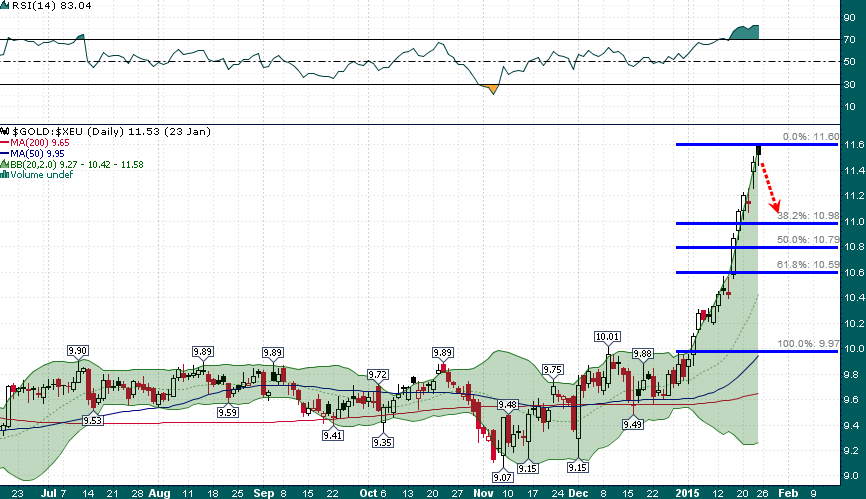
Gold in euro terms has been stretching the upper Bollinger® band higher as it has broken out. In addition, the daily RSI(14) has moved into extreme overbought territory above 80. Friday’s ‘hanging man‘ candlestick has been confirmed lower via yesterday’s gap down and nearly 2% move lower. Using Fibonacci levels it would seem reasonable that the € price of gold might be headed down to the 1100 level over the coming days:

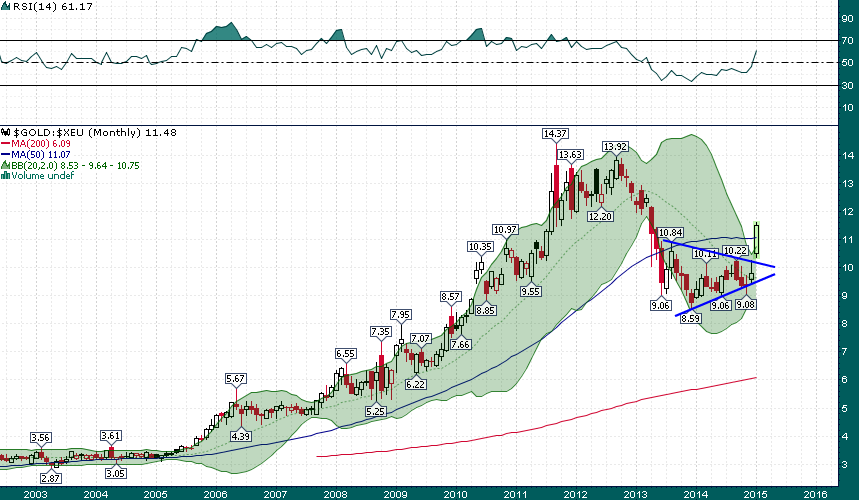
While the technical structure of the daily chart of gold/€ suggests a short term correction is imminent, the breakout on the monthly chart is quite significant and offers a bullish longer term outlook:
