
XAU/USD traded higher yesterday, breaking above the peak of March 9, at 1704, that way reaching a new 8-year high. The precious metal has been printing higher highs and higher lows above an upside support line taken from the low of March 19, while since April 2, it’s been trading above all three of our moving averages on the 4-hour chart. In our view, these technical signs paint a positive near-term picture.
If the bulls are willing to stay in the driver’s seat, we would expect them to climb towards the 1755 territory, defined as a resistance by the highest point of November 2012. If they are strong enough to overcome that obstacle as well, then we may see them putting the 1795 zone on their radars. That zone marks the peak of September 2012.
Shifting attention to our short-term oscillators, we see that the RSI, already above 70, hit support near that mark and turned up again. The MACD lies above both its zero and trigger lines, but currently points sideways. Both indicators detect upside momentum but the flattening of the MACD makes us careful with regards to a possible pullback soon, perhaps after the price challenges the 1755 area.
In order to start examining the case of a trend reversal though, we would like to wait for a decisive dip below the 1672 barrier, defined as a support by the inside swing highs of March 11 and April 7. Such a move could initially open the path towards the low of April 8, at around 1641, the break of which could carry more bearish implications, perhaps setting the stage for the 1605 hurdle, marked by the low of April 3.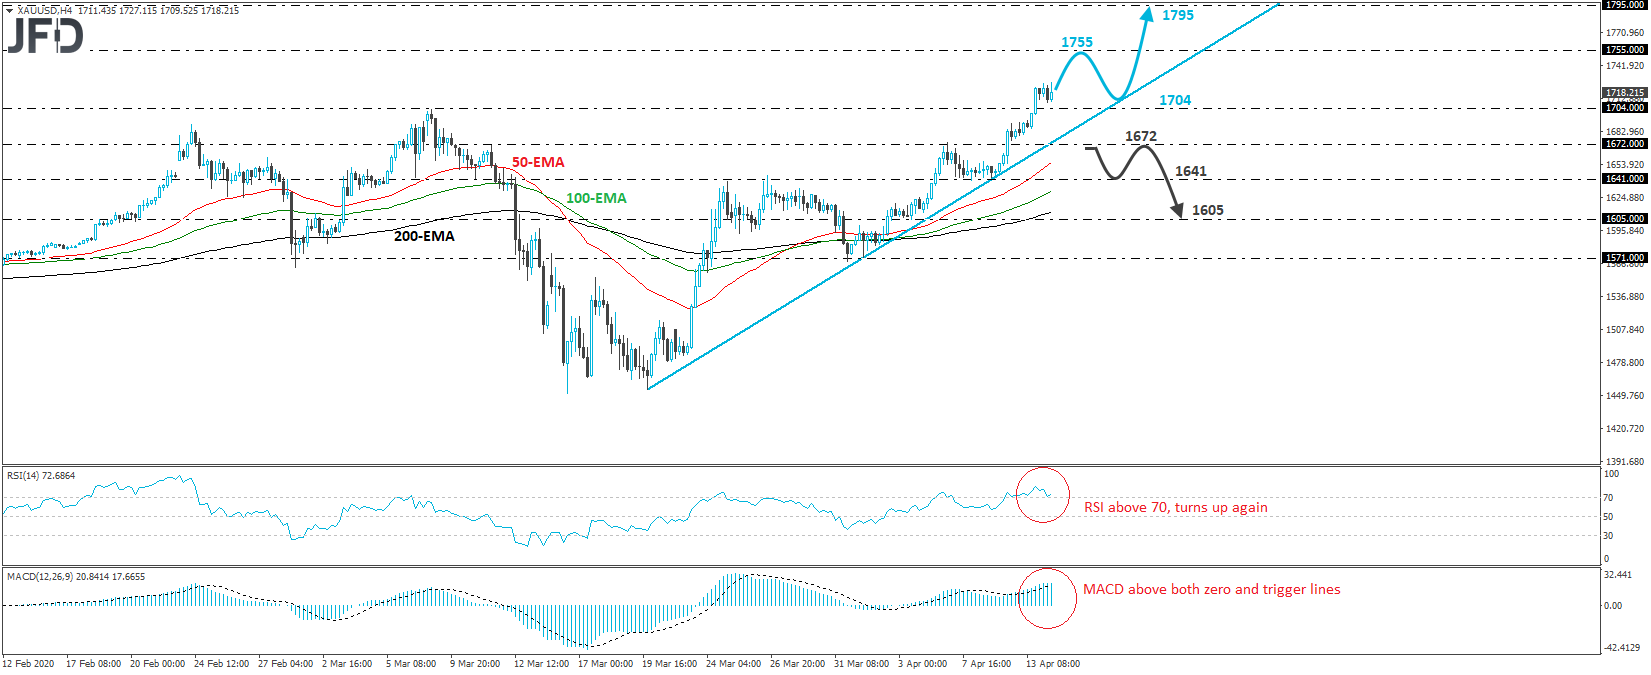
- English (UK)
- English (India)
- English (Canada)
- English (Australia)
- English (South Africa)
- English (Philippines)
- English (Nigeria)
- Deutsch
- Español (España)
- Español (México)
- Français
- Italiano
- Nederlands
- Português (Portugal)
- Polski
- Português (Brasil)
- Русский
- Türkçe
- العربية
- Ελληνικά
- Svenska
- Suomi
- עברית
- 日本語
- 한국어
- 简体中文
- 繁體中文
- Bahasa Indonesia
- Bahasa Melayu
- ไทย
- Tiếng Việt
- हिंदी
Gold Hits A New 8-Year High
Latest comments
Loading next article…
Install Our App
Risk Disclosure: Trading in financial instruments and/or cryptocurrencies involves high risks including the risk of losing some, or all, of your investment amount, and may not be suitable for all investors. Prices of cryptocurrencies are extremely volatile and may be affected by external factors such as financial, regulatory or political events. Trading on margin increases the financial risks.
Before deciding to trade in financial instrument or cryptocurrencies you should be fully informed of the risks and costs associated with trading the financial markets, carefully consider your investment objectives, level of experience, and risk appetite, and seek professional advice where needed.
Fusion Media would like to remind you that the data contained in this website is not necessarily real-time nor accurate. The data and prices on the website are not necessarily provided by any market or exchange, but may be provided by market makers, and so prices may not be accurate and may differ from the actual price at any given market, meaning prices are indicative and not appropriate for trading purposes. Fusion Media and any provider of the data contained in this website will not accept liability for any loss or damage as a result of your trading, or your reliance on the information contained within this website.
It is prohibited to use, store, reproduce, display, modify, transmit or distribute the data contained in this website without the explicit prior written permission of Fusion Media and/or the data provider. All intellectual property rights are reserved by the providers and/or the exchange providing the data contained in this website.
Fusion Media may be compensated by the advertisers that appear on the website, based on your interaction with the advertisements or advertisers.
© 2007-2025 - Fusion Media Limited. All Rights Reserved.