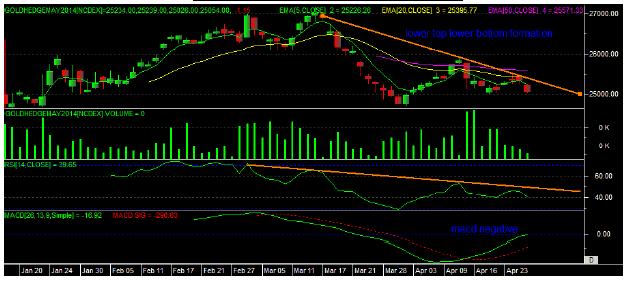
MUMBAI: On the above daily NCDEX Gold Hedge price chart, we have seen that from the inception to till date NCDEX Gold Hedge price are trading in a sideways trend. NCDEX Gold hedge prices had opened the contract at 25,000 levels and in the same time it made a high of 27,200 levels. After making of high of 27,200 levels we have seen that prices are trading in a “Lower Top Lower Bottom formation” which is basically indicating pessimism.
Gold Daily prices are trading below its 5, 20 and 50 Day EMA (Exponential Moving Average), indicating there may be room for more downside.
On oscillator’s front, MACD is in negative zone and 14 Day RSI is also falling which also supports the bear trend. Prices have a strong support at 23,000 levels and below that at 19,500 levels. Resistance is seen at 30,000 levels.
Due to multiple factors indicating bearishness - we are recommending to sell Gold on rallies for a downside target of 23600 levels. However, on a lower side around 23,000 levels appears to be strong support level and price should bounce from these levels. Hence one can initiate a long position at these levels.
- English (UK)
- English (India)
- English (Canada)
- English (Australia)
- English (South Africa)
- English (Philippines)
- English (Nigeria)
- Deutsch
- Español (España)
- Español (México)
- Français
- Italiano
- Nederlands
- Português (Portugal)
- Polski
- Português (Brasil)
- Русский
- Türkçe
- العربية
- Ελληνικά
- Svenska
- Suomi
- עברית
- 日本語
- 한국어
- 简体中文
- 繁體中文
- Bahasa Indonesia
- Bahasa Melayu
- ไทย
- Tiếng Việt
- हिंदी
Gold Hedge: Pessimism And More Potential For Downside!
Published 05/02/2014, 07:13 AM
Updated 05/14/2017, 06:45 AM
Gold Hedge: Pessimism And More Potential For Downside!
Latest comments
Loading next article…
Install Our App
Risk Disclosure: Trading in financial instruments and/or cryptocurrencies involves high risks including the risk of losing some, or all, of your investment amount, and may not be suitable for all investors. Prices of cryptocurrencies are extremely volatile and may be affected by external factors such as financial, regulatory or political events. Trading on margin increases the financial risks.
Before deciding to trade in financial instrument or cryptocurrencies you should be fully informed of the risks and costs associated with trading the financial markets, carefully consider your investment objectives, level of experience, and risk appetite, and seek professional advice where needed.
Fusion Media would like to remind you that the data contained in this website is not necessarily real-time nor accurate. The data and prices on the website are not necessarily provided by any market or exchange, but may be provided by market makers, and so prices may not be accurate and may differ from the actual price at any given market, meaning prices are indicative and not appropriate for trading purposes. Fusion Media and any provider of the data contained in this website will not accept liability for any loss or damage as a result of your trading, or your reliance on the information contained within this website.
It is prohibited to use, store, reproduce, display, modify, transmit or distribute the data contained in this website without the explicit prior written permission of Fusion Media and/or the data provider. All intellectual property rights are reserved by the providers and/or the exchange providing the data contained in this website.
Fusion Media may be compensated by the advertisers that appear on the website, based on your interaction with the advertisements or advertisers.
© 2007-2025 - Fusion Media Limited. All Rights Reserved.

