⭐ Start off 2025 with a powerful boost to your portfolio: January’s freshest AI-picked stocksUnlock stocks

Fundamental And Technical Indicators Point To Gold Shooting Higher

Published 07/23/2020, 05:58 AM
Updated 07/09/2023, 06:31 AM

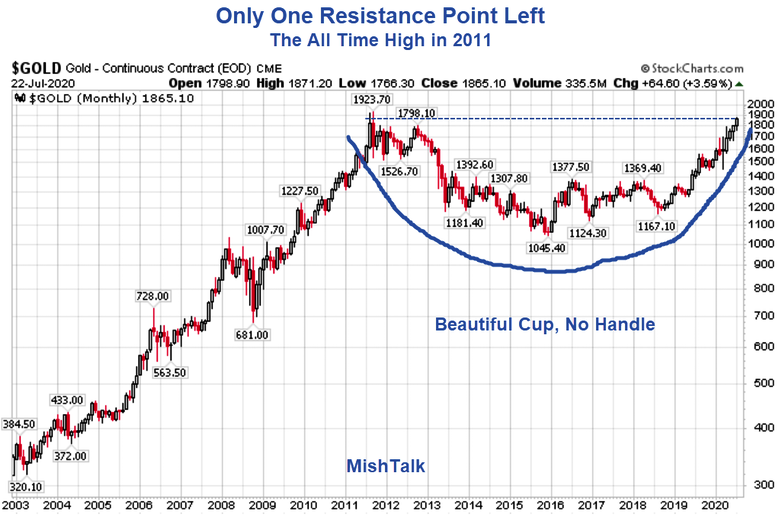
Gold Monthly Chart

On a monthly chart, the last resistance point for gold is the $1923 peak in 2011.

Why Gold?

Tensions of all sorts are on the rise in the US, EU, and globally: COVID, employment, fiscal stimulus China (military and economic), and massive increases in money supply by the central banks, especially the Fed.

Cup and Handle

The Cup and Handle is a technical formation. A handle is formed on a pullback before the pattern blasts higher.

Of course, there may be no handle. Gold may just blast higher (or collapse) but fundamentals suggest higher, perhaps after some consolidation.

Gold vs Faith in Central Banks
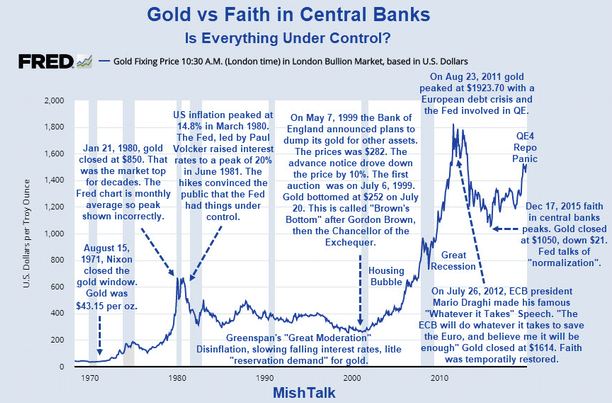
Gold Vs Faith In Central Banks

Gold does worst when faith in central banks is the highest. Greenspan's great moderation is the best example. Greenspan was considered the great "Maestro" who could do no wrong.

That theory crashed to earth in the DotCom bust. We have now had 3 major economic bubbles in 20 years.

It should be obvious that the Fed is boosting financial assets but that is not going to create jobs or cure COVID.

I do not see a reversal in Fed policy. Do you?

Original Post

Latest comments

Loading next article…
Risk Disclosure: Trading in financial instruments and/or cryptocurrencies involves high risks including the risk of losing some, or all, of your investment amount, and may not be suitable for all investors. Prices of cryptocurrencies are extremely volatile and may be affected by external factors such as financial, regulatory or political events. Trading on margin increases the financial risks.
Before deciding to trade in financial instrument or cryptocurrencies you should be fully informed of the risks and costs associated with trading the financial markets, carefully consider your investment objectives, level of experience, and risk appetite, and seek professional advice where needed.
Fusion Media would like to remind you that the data contained in this website is not necessarily real-time nor accurate. The data and prices on the website are not necessarily provided by any market or exchange, but may be provided by market makers, and so prices may not be accurate and may differ from the actual price at any given market, meaning prices are indicative and not appropriate for trading purposes. Fusion Media and any provider of the data contained in this website will not accept liability for any loss or damage as a result of your trading, or your reliance on the information contained within this website.
It is prohibited to use, store, reproduce, display, modify, transmit or distribute the data contained in this website without the explicit prior written permission of Fusion Media and/or the data provider. All intellectual property rights are reserved by the providers and/or the exchange providing the data contained in this website.
Fusion Media may be compensated by the advertisers that appear on the website, based on your interaction with the advertisements or advertisers.
© 2007-2025 - Fusion Media Limited. All Rights Reserved.