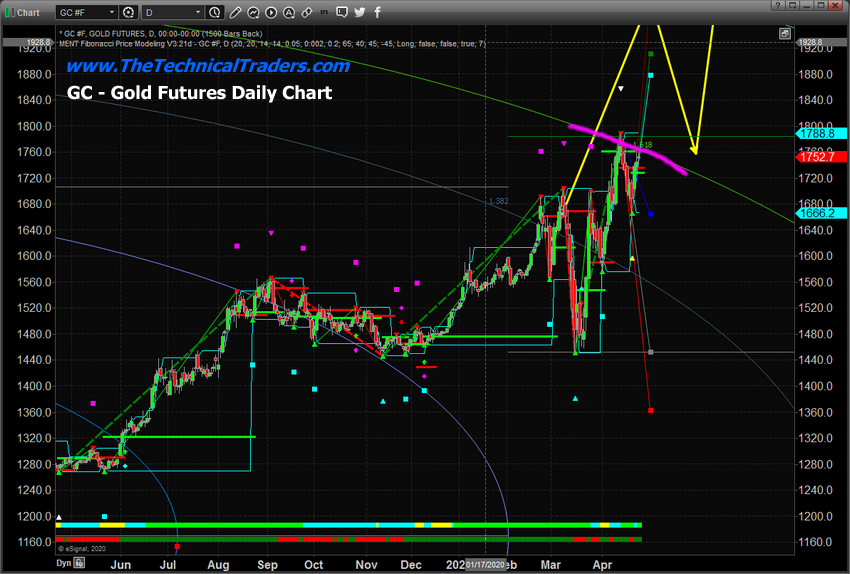
Our research team authored an article on April 24, suggesting gold would have to clear a major resistance channel/arc before any further attempt at a rally would take place. You can read that article here.
At that time, we expected this resistance channel to contain gold prices for a short 10 to 14+ days before a bigger upside price move was going to begin. You can see from our original charts that we believed the resistance channel would be broken fairly quickly. Yet, gold has continued to trail moderately lower as the U.S. stock market has continued to rally and the U.S. Fed has stepped up its support and is buying up all sorts of debt and assets.
Original April 24 Daily Gold Chart

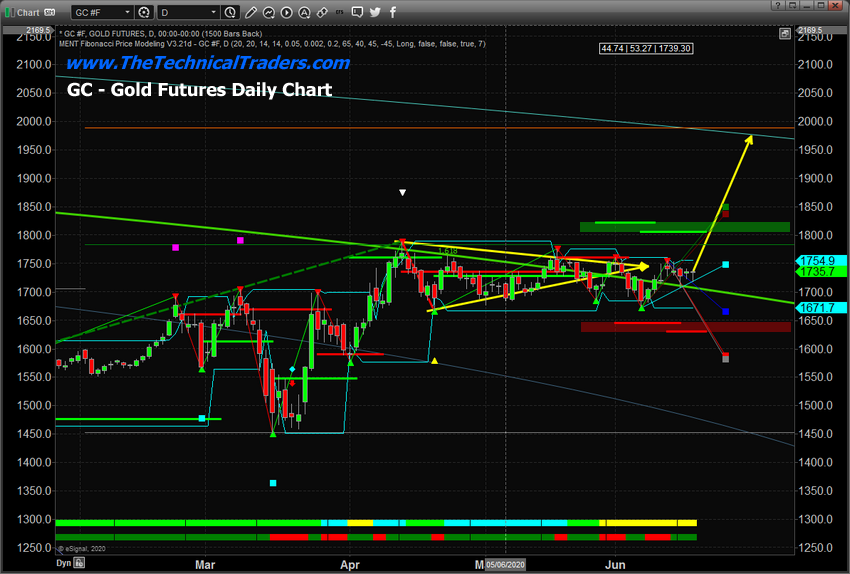
Current Daily Gold Chart
Comparing the original chart to the current Daily Gold chart, below, you should be able to see how the price has now established a base above the GREEN ARCING resistance channel that we believe is the final hurdle before gold attempts a move to levels above $2,100. Although gold has yet to really start a massive upside price rally, at this point we believe the big move higher could start at any moment.
The U.S. Fed has continued to warn that the recovery process may be full of unknowns and risks. The global markets are going to react to what happens in the U.S. markets and Q2 data is just a few weeks away. We believe precious metals are poised to make another 10% to 20% upside price move that may initiate at any moment. All it takes is a push away from these consolidation levels to put gold and silver back on the radar for traders. Once traders see the move start – they will pile into the rally just like they always do as many people expect gold to rally above $2,500 before the end of this year.
Gold prices must move upward to levels above $1,825 to confirm a new bullish trend or downward below $1,630 to confirm a new bearish trend. See the highlighted GREEN and RED rectangles on this
Gold Daily Chart.

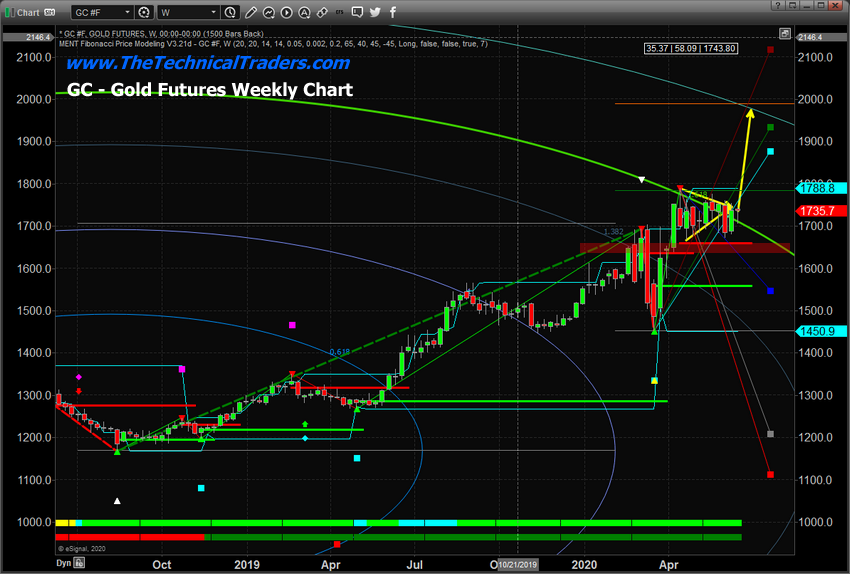
Current Weekly Gold Chart
This current Weekly Gold chart shows how the price has stayed glued to the GREEN Fibonacci Price Amplitude Arc and how clearly these levels act as real resistance or support. The Weekly Gold Chart already confirms the bullish price trend for gold and supports the $1,630 bearish price trigger target for any move to the downside. In other words, gold would have to fall below $1,630 to qualify as
entering a new bearish price trend.

The next upside move in gold and silver could start at any moment. The current support level in gold suggests $1,680 to $1,700 is strong support and all it would take to start this next big move is a
sprinkling of “fear” to start a precious metals greed cycle again. How that happens, normally, is that the general stock markets move into a declining price phase on economic weakness or poor earnings
data (or worse) and traders suddenly watch gold rally up 5 to 7% fairly quickly. At that point, traders begin to focus on the metals and the fact that we are just about $200 away from new all-time highs.
It won't take much to push gold into the $2,100 level and once that happens there will be talks of $5,000, $10,000 – even $20,000 gold prices. Watch for the next sign of real weakness in the U.S. stock
market (possibly a breakdown event or some other event) and watch for gold to attempt to rally above $1,775. That would be a pretty good sign that the upside price rally in metals has initiated.
