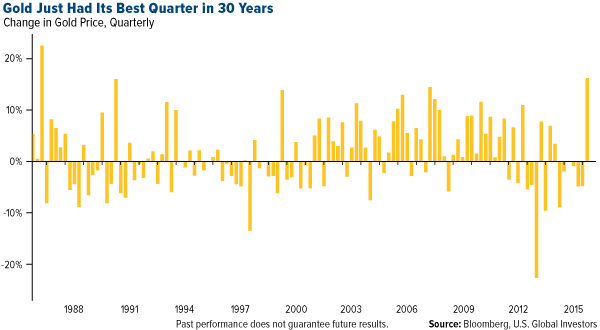
The last time gold had a quarter this strong, Ronald Reagan was a year into his second term as president, the Soviet Union was taking its final gasp and the U.S. was still reeling from the Challenger explosion. In the first quarter, the yellow metal rose 16.5 percent, its best three-month performance since 1986, mostly on fears of negative interest rates and other global central bank policies.
Bloomberg writes that the current gold rally has “cemented its status as a store of value.” Before now, a gold bear market persisted not because the metal had lost its status necessarily, but because of the strong U.S. dollar and, more significantly, positive real interest rates. According to Pierre Lassonde, cofounder of Franco-Nevada (NYSE:FNV), gold is the fourth most liquid asset in the world.
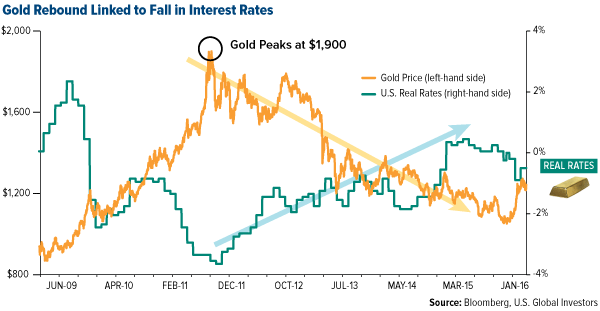
As I’ve mentioned many times before, gold has historically performed best when real rates turned negative. We were one of the earliest to discuss this important relationship on a regular basis, and now I’m starting to see it covered frequently in the mainstream media.
To get the real rate, you subtract the current consumer price index (CPI) reading, or inflation, from the government bond yield. When yields are low—or negative, as they are now—it encourages smart investors to seek other stores of value, including gold.
Below, you can see that when gold prices peaked at $1,900 per ounce in August 2011, real interest rates were close to negative 4 percent. A 5-Year Treasury bond yielded only 0.9 percent—and that’s before inflation took 3.8 percent. (Decades ago, when I was a young analyst in Canada, we would compare everything to the 5-year government bond yield.) But as real rates rose, gold prices fell. Now the reverse is happening.
Double the Gold Returns Under Negative Real Rates?
Most investors look only at nominal interest rates. This is only the tip of the iceberg. The British author and playwright Oscar Wilde wrote: “Nowadays people know the price of everything and the value of nothing.” Along those lines, smart investors know that money flows to the highest real interest rate. I call this the Fear Trade.
“When real rates are negative, gold returns tend to be twice as high as the long term average,” the World Gold Council (WGC) writes its latest report. “Even if real rates are positive and as long as they are not significantly high (4 percent in our study), average gold returns remain positive.”
Negative rates erode confidence in fiat currencies, which typically has benefited gold. A currency itself, gold is “the only one that is not targeted directly by, and doesn’t respond negatively to, expansionary monetary policies,” the WGC writes.
The chart below shows the difference in the nominal and real yield curves for government bonds in a number of advanced economies. When you factor in inflation, investors of shorter-term government debt are actually paying the government to hold their money, a proposition that’s hard to swallow.
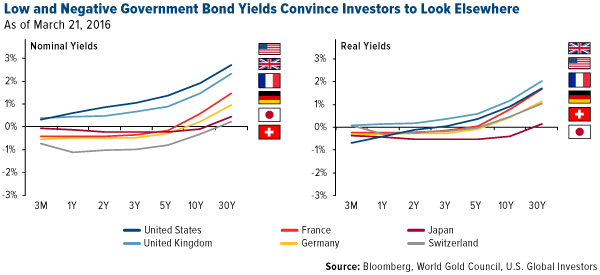
The WGC points out that about 30 percent of global sovereign debt is now trading with subzero yields. That’s $8 trillion! A further 40 percent has yields below 1 percent.
This is just the latest reason why investors have been losing faith in central banks. In its most recent quarterly report, the Bank for International Settlements (BIS) notes that investors’ “confidence in central banks’ healing powers has—probably for the first time—been faltering,” as it becomes more and more clear that room for additional policymaking is narrowing. If asset-buying programs, helicopter drops of money and negative interest rate policies fail to reverse the economic slowdown, what more is there?
These conditions have led to a surge in gold coin and bullion sales around the world. American Eagle consumers bought 83,500 ounces of the coin in February, a 351 percent increase from the 18,500 ounces sold in the previous February. The Perth Mint in Australia is also reporting huge sales volumes.
Retail Investors Missing out on the Gold Rush
Interest in gold bullion, however, hasn’t seemed to translate fully into renewed interest in gold miners. So far this year, inflows into the SPDR Gold Trust Fund (NYSE:GLD), which invests in physical bullion, have accelerated as investors chase the rally. 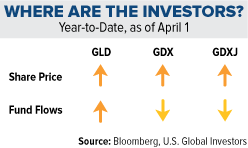
At the other end is the Market Vectors Junior Gold Miners ETF (NYSE:GDXJ), which holds junior gold equities such as Northern Star, OceanaGold and Evolution Mining. Despite an increase in share price, we’ve seen a net decrease in shares outstanding.
Year-to-date, outflows have totaled $84 million. Flows out of the Market Vectors Gold Miners ETF (NYSE:GDX), which holds senior gold stocks, have been even more dramatic, at $94 million.
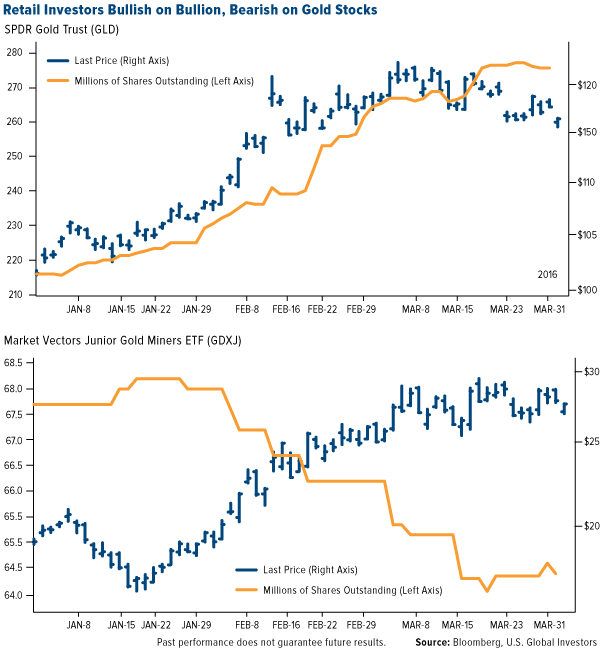
This could be explained by investors taking profits off the table, unease with the volatile swings in the gold market lately or mistrust in mining stocks. In any case, many investors could be missing out on one of the most impressive gold rallies in a generation. Since the start of the year, Goldcorp (NYSE:GG) has gained 38-percent, Randgold (NASDAQ:GOLD) 45-percent, Barrick Gold (NYSE:ABX) 84-percent, Harmony Gold (NYSE:HMY) 300-percent.
Good News! Global Manufacturing Turns Up
Another concern investors have right now is over the health of the global economy. Since February 2014, we’ve seen the J.P.Morgan Global Manfacturing Purchasing Managers’ Index (PMI) trend steadily downward.
For March, however, the PMI came in at 50.3, a slight improvement from the neutral February reading of 50. The monthly reading also rose above the three-month moving average, a bullish signal.
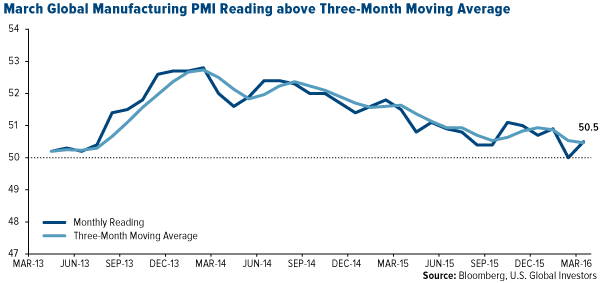
We use PMI data as a gauge for commodity price movements three and six months out, and I write about PMI often. The U.S. Manufacturing ISM—the American version of PMI—showed improvement, rising from 49.5 in February to 51.8 in March, the first time it expanded in seven months. New Orders strengthened in particular, gaining 6.8 percentage points to register 58.3 last month. Meanwhile, the Markit Eurozone Manufacturing PMI edged up slightly to 51.6, from 51.2 in February.
China, on the other hand, continues to exhibit deterioration. Although the Caixin China General Manufacturing PMI rose to 49.7 in March from 48 in February, the reading is still below the key 50 benchmark that separates contraction and expansion.
Disclosure: This commentary should not be considered a solicitation or offering of any investment product. Certain materials in this commentary may contain dated information. The information provided was current at the time of publication.

