While some analysts are getting a bit negative in their outlook for gold, the physical market is getting stronger and that’s very good news for investors.
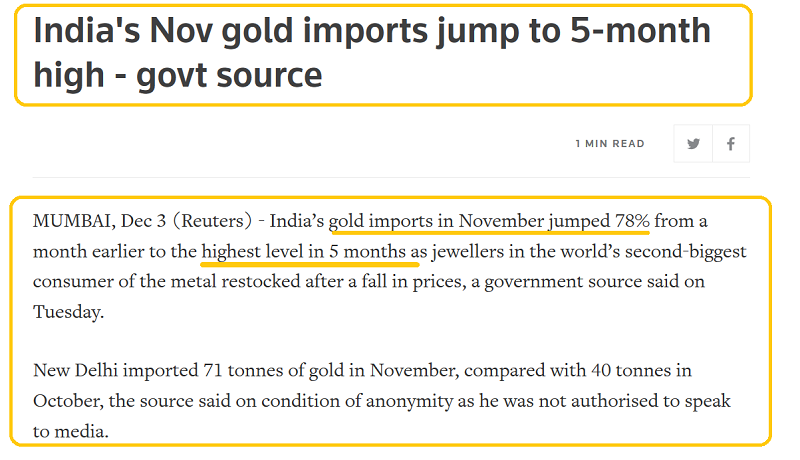
I predicted that Indian jewellers would step into the market in the $1465 area, and that has obviously occurred.
Given the onerous import duty, November demand in the official market was outstanding. Black (free) market demand was also likely very strong.
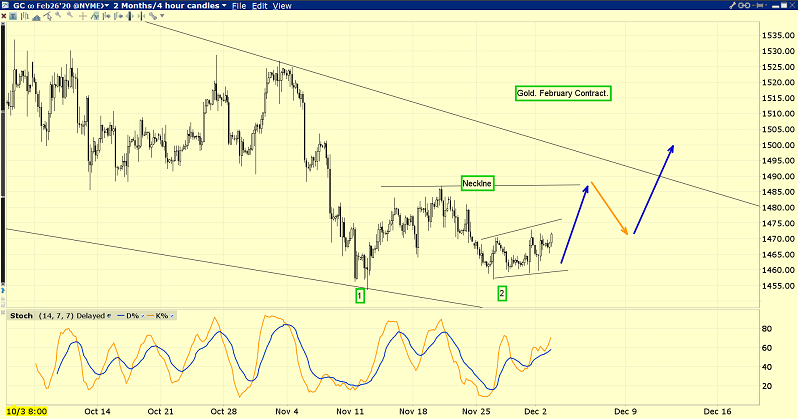
There’s a beautiful double bottom pattern in play on this short-term gold chart.
Investor sentiment collapsed on the second low and that’s “textbook” action for this type of bullish pattern.
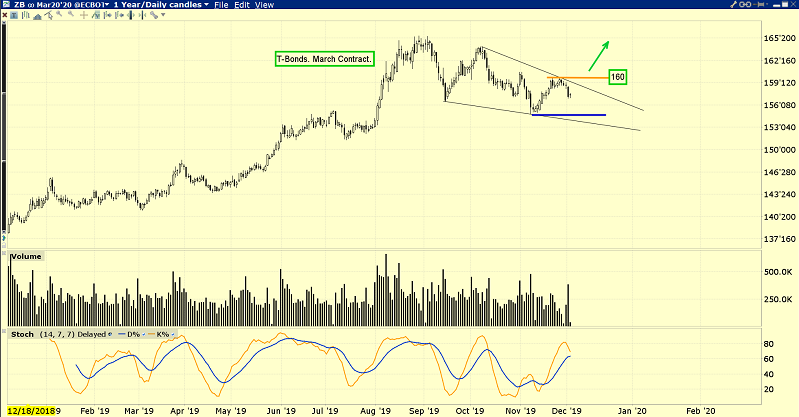
Bond market charts look very similar to gold market charts right now.
A move above 160 on the T-bond chart would add some serious “mojo” to gold, and I’m predicting that it happens soon.
In the late 1920s, Herb “I’m a Tariff Tax Man” Hoover’s tariff tax tantrum resulted in the election of Roosevelt (FDR), who was a vile gold hater and socialist. After confiscating their gold, FDR happily sent 400,000 soldiers to die in various wars.
Donald Trump is gambling that his tariff tax tantrum won’t result in the 2020 election of another crazed socialist, like Warren, Sanders, or Ocasio, but I wonder if he’s aware of the potentially dire consequences of his actions.
It’s a huge gamble to take. His tax cuts produced surging GDP and surging global stock markets. More tax cuts were a “no-brainer”, but instead he’s risking it all with these tariff taxes. From a risk versus reward perspective, there’s very little potential reward and enormous risk.
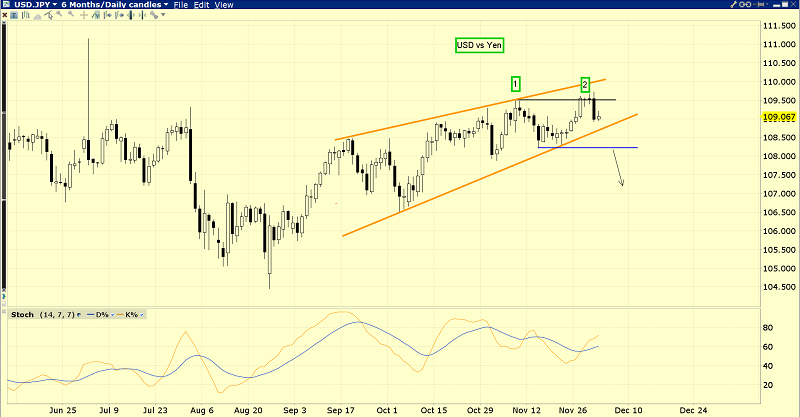
The ominous dollar versus yen chart.
FOREX traders are obviously concerned about the possibility that the US government’s endless waves of GDP-destructive tariff taxes result in the election of an unstable socialist government.
While gold forms a double bottom and Indian dealers buy aggressively, the dollar has formed a double top within a very bearish wedge pattern.
A breakdown from the top pattern would likely be accompanied by a crashing stock market and soaring gold, soaring silver, and soaring gold stocks!
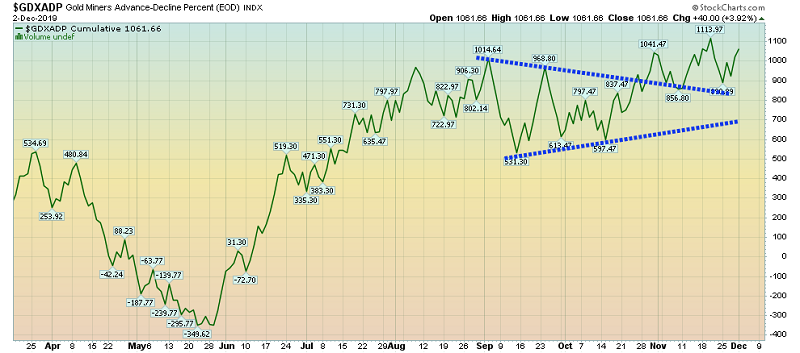
Many individual miners are currently roaring to fresh highs for the year, and this VanEck Vectors Gold Miners ETF (NYSE:GDX) Advance-Decline chart showcases the action.
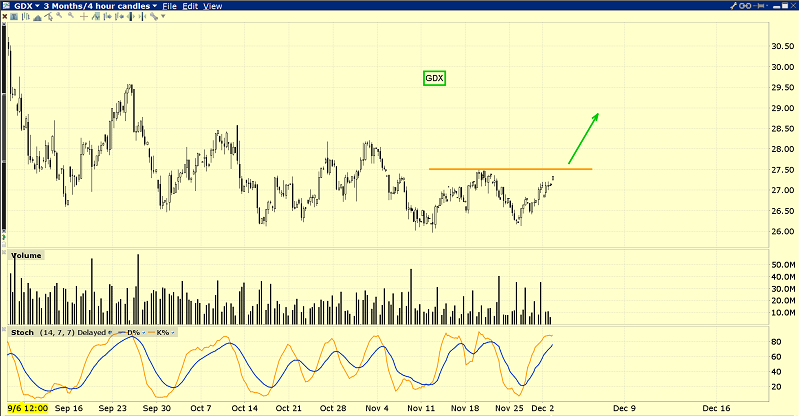
The superb short-term GDX (NYSE:GDX) chart.
I’m predicting an imminent upside breakout from the double-bottom pattern, and it could happen today!
With India back on the buy and US manufacturing in recession, the stock market is on very shaky ground.
The Fed is pumping out “QE that is not QE”, and Trump may need to ramp up government spending and debt to counter the negative effects of his tariff taxes, if he wants to get re-elected.
Monday’s COT report shows the commercial traders reducing short positions significantly, which I expected given the obvious surge in Indian demand.
All my proprietary weekly chart signals are now in buy mode for gold and for the GDX/GOAU ETFs. Short-term traders can use my guswinger.com signals to take NUGT and DUST signals… to ride the gravy train on the next big run for gold!
History rhymes more than it repeats, and I suggested that gold’s reaction was more likely to bottom in mid-November than December this year.
The exact low for gold was November 12.
Seasonality and charts are created by liquidity flows in the physical market and on the COMEX. The bottom line for gold: Good times are here, and great times are near.
Stewart Thomson is a retired Merrill Lynch broker. Stewart writes the Graceland Updates daily between 4am-7am. They are sent out around 8am-9am. The newsletter is attractively priced and the format is a unique numbered point form. Giving clarity of each point and saving valuable reading time.
