From back in '69, on the The Moody Blues LP "To Our Children's Children's Children", Side 1 Track 7 is entitled "Out and In", the journey this year clearly having been Out of Gold rather than In. Indeed one might say "Way Out, man..." To wit:
A regular enthusiast of the Metals & Minerals Investment Conference, the circus having made its annual pass through San Francisco during the week, informed us that attending such a gathering of the hard assets herd this time 'round was as if walking into a morgue. And no wonder, really, given both Gold being off 28% and Silver 39% from that assemblage's date a year ago. Gold and its precious metals' brethren per the popularity list are on the Out side of the ledger, (along with personal responsibility, freedom and those pulling the cart), as opposed to the S&P and its stock market brethren being on the In side, (along with cultural depravity, sameness and gimmie gimmie gimmie). Politics aside, Gold's being Out and foundationless paper being In is inarguably the stark, current reality. And yet, there is the earliest evidence of the tide being on the threshold of turning.
What has to happen, at the most rudimentary level, for the price of Gold to materially resume rising?
"More trades hitting the offers than the bids, mmb?"
When one senses a protégé having come full circle, one has a quietly emotive moment of pride. Squire is, of course, spot on. As we've said before, the invested base in Gold simply has to increase. Similar to the way in which its downside commenced, setting Gold into upside motion can certainly be initiated by a renowned player's stake being increased, hedge funds hoovering up multiple levels of ask prices in the middle of the night, and central banks coming to market to further shore up protection against the erosion of their aging asset values. Then, as word of such begins to ripple about the FinMedia, Gold will move across the ledger from being Out to In.
Next would come the public at large, which as we oft pass along is reportedly at best just 5% management-invested in Gold. And what I now find fascinating is this: just over the most recent weeks, without me even broaching the subject in conversation, I've heard more "lay" people comment about the state of the Dollar in debasing terms, whether jokingly or with expressed concern, than I can ever remember. On Thanksgiving evening I was privileged to join a group of some 16 fine folks, all unbeknown to me except for the host, and typically representative of our Bay Area's eclectic spectrum. In listening in on no less than three mutually exclusive exchanges, (one on the deck, one in the kitchen and one in the salon), did someone (not me) mention a pending plight for the Dollar. The mainstream just may be starting to get it.
Now: does that mean they're all going to race out to the Gold dealer or broker and starting loading up? Of course not, albeit Gold did rise 1.1% Friday. But tens of millions of Thanksgiving gatherings took place across the land on Thursday. And 'tis this incipient Dollar-skeptical awareness from which the snowball beings to roll and expand. As we've pointed out in the past, just imagine to where the price of Gold would extend should its managed investment base be increased to a mere 10%(!) Moreover, as herein penned back on 26 October: "Today M2 is $10.970T, an increase since 1981 of 553%. Applying same increase from Gold's average price in 1981 puts it today at $2,566/oz."
Yet: we're better than 50% below such logically -- indeed some might say "conservatively" -- extrapolated level, as neither does it take into account the fiat follies of other nations nor other save-haven notions.
But the reality is that Gold remains way down here at 1251 and its current parabolic Short trend on the weekly bars is now eight weeks in duration per the rightmost descending batch of red dots below:
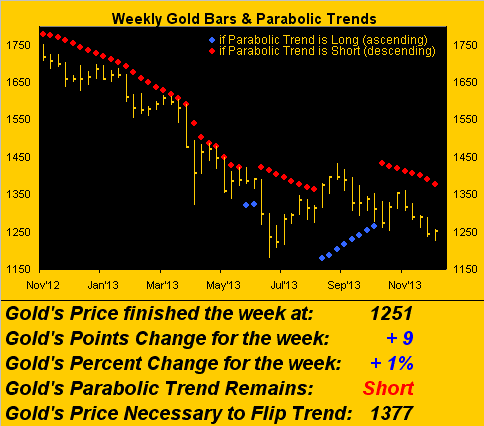
Regular readers shall recall the positive tilt the above picture woulda/shoulda/coulda taken if the current Short trend had been curtailed at less than eight weeks, and thus have underperformed the eight-week duration of the prior Long trend's ascending blue dots. Delirium.
Further, given we've arrived at month's end, 'tis time to bring up (in more ways than one!) Gold's year-over-year percentage performance comparison to that of its paper pals which include the Gold Bugs Index (HUI), Philly Exchange Precious Metals Index (XAU), the exchange-traded fund for the miners (GDX) and our roller-coaster royalty favourite Royal Gold (RGLD). "Gobble-Gobble":
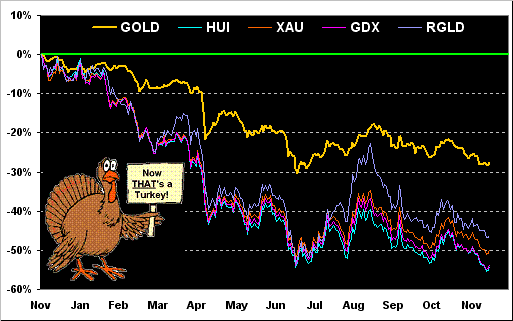
Whilst the paper is twice as bad to the downside as is the metal , 'tis purported to perform twice as good to the upside, as you can discern above through the July-September period. But the degree to which the Gold equities shall suffer in what I deem as an ensuing stock market crash, it goes without saying, is not necessarily metal-dependent: during 2008's Black Swan run of chaotic market violence from mid-September through October, GDX was pummeled -33% whilst Gold itself declined just -6%.
Speaking of unsustainability, (ahem-ahem), you sharp-eyed readers out there may well recall that as of a month ago, were the S&P (now 1806) to maintain its year-to-date growth rate at that time, 'twould eclipse 2,000 on 11 April 2014. With that in mind, let's now look in on its percentage performance over just the last 21 trading days (i.e. now one month later), along with that for Gold. Should the S&P continue to rise at a pace of 3% per month, look for that 2,000 level to instead arrive on the Ides of March, (which for you WestPalmBeachers down there is the 15th). Hail Caesar indeed. Even more zany, were Gold to decline 6% each month, 'twould be at 560 by 2014 year's end:
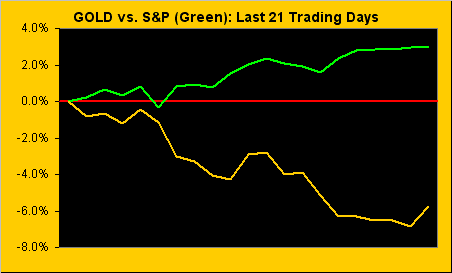
For both cases, I'll only believe 'em if I see 'em.
Instead let us turn to "the now", this next two-panel graphic as directly culled from the website's daily updated page for Gold. Below on the left we've Gold's three months-to-date daily bars and attendant "Baby Blues" whose normally beautiful sweeping flows have instead turned to "Bizarre Bobblings", a quantitative hint that any construction of near-term trend sustainability is terribly lacking, regardless of direction, and that thus broader-term consolidation is finally underway:
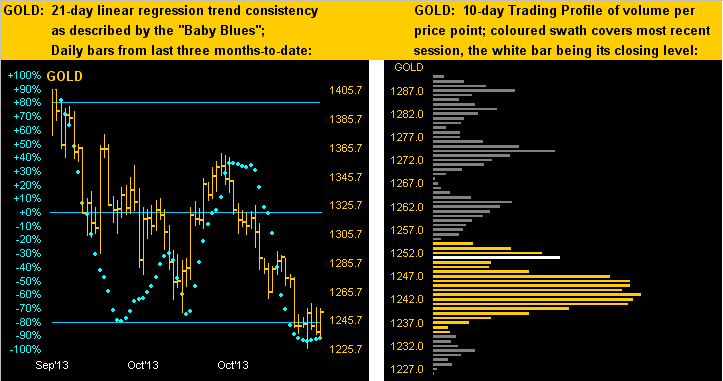
Above on the right we've Gold's trading profile for the past two weeks (10 sessions), wherein there's been built that fat finger of support in the 1246-1241 zone, opening the opportunity for Gold to test those higher resistance apices in the panel's upper-half. To be sure in the past week, as has been pointed out in our daily commentary, two of Gold's three best Market Rhythms -- the MACD study on its 8-hour bars and same on the 12-hour bars -- have crossed to positive disposition, (for those of you familiar with MACD meaning the histogram bars are up), the third rhythm waiting in the wings being for the MACD on the daily bars. 'Tis nice to have these near-term measures of Gold's swinging from Out to In, yet a bit soon perhaps to assert such for the broader-term: but one must start from somewhere.
From somewhere indeed as we next slide over to Sister Silver, or perhaps better stated, Sleepy Silver. Just have a look at the white metal's current "expected daily trading range":
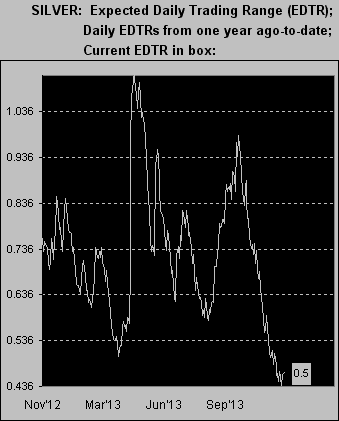
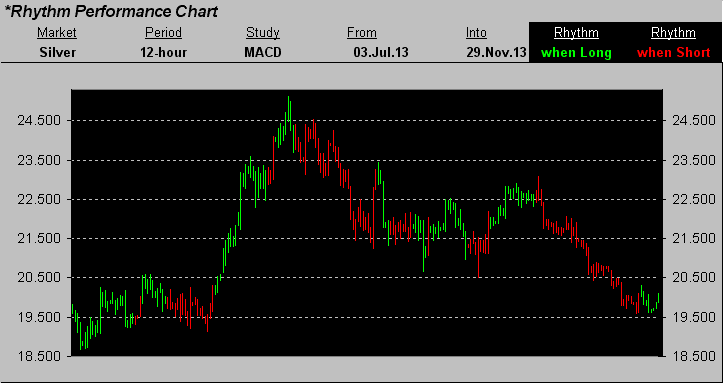
Time for Silver to perk up a bit, what? Its currently modest level of 20.015 can't seem to extend better than 0.5 points in either direction. But as has Gold's 12-hour MACD study turned positive, so has that for Silver. Our following website chart is that of Silver's 12-hour bars from early July-to-date. It does not specifically show the MACD study itself, but rather green price bars when such study is positively disposed, and red price bars if negatively disposed. Whilst most time-based studies are hardly perfect due to their time lag behind actual price movement, Silver's 12-hour MACD crossover signals have been impressive in spite of the narrowing daily price range. In nine of the last ten MACD crossings, (i.e. upon the price bars changing colour), Silver has followed through in the same direction by at least 0.240 points, which is $1,200/contract. Hindsight results hardly continue in perpetuity, but it "pays" to keep an eye on this Market Rhythm, the price bars of which as you can see are now green:
And thus should Silver be turning higher, why not Gold as well, right? After all, in the broadest context, our friend below does ask quite the rhetorical question...
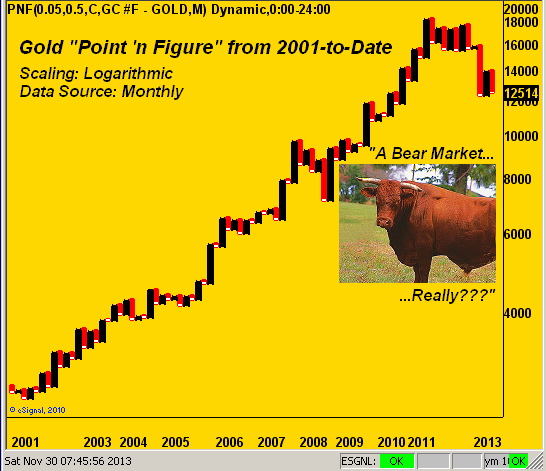
..and what in the above chart follows each red down column? Christmas just may be coming early for Gold this year(!)
Finally, I'm wondering if dear old England, or perhaps better yet Scotland, is the place to which to relocate. StateSide, the revolutionary mandated healthcare insurance mechanism seems poised to crater our economy. Across the sea, Bank of Japan officials are now on record of saying they see risks to the outlook for their own economy. The EuroZone meanwhile continues to experience sufficiently low inflation that 'tis underscoring weaknesses in parts of that economy. So those regions of the world appear to be Out. But the UK apparently is becoming the In place to be, its Q3 growth rate now confirmed at 0.8% such that economic recovery there is gathering pace. Indeed, I'm further wondering if I should ever have left Barclays: clearly they've money having just been ordered to pay an derivatives dealer who was fired over the LIBOR scandal some $2.2 million and we now read that pay for UK's top bankers is to be up by a third over that of last year. Not a bad deal, pound for pound ... but upon further reflection: Gold is good everywhere.
Here's the state of its stack:
- Gold’s All-Time High: 1923 (06 September 2011)
- The Gateway to 2000: 1900+
- The Final Frontier: 1800-1900
- The Northern Front: 1750-1800
- Year-to-Date High: 1697
- The Floor: 1579-1466
- The 300-day Moving Average: 1495 (now sub-1500!)
- Le Sous-sol: Sub-1466
- Structural Resistance: 1462-1478 / 1523-1535 / 1554
- The Weekly Parabolic Price to flip Long: 1377
- Base Camp: also 1377
- Trading Resistance: 1263 / 1274 / 1283 / 1287
- 10-Session “volume-weighted” average price magnet: 1255, (directional range: 1291 down to 1226 = 65 points or -5%)
- Gold Currently: 1251, (weighted-average trading range per day: 19 points)
- Trading Support: 1246-1241 / 1231
- Year-to-Date Low: 1179
- Structural Support: 1163 / 1033 / 1007
I count no less than 30 elements of incoming econ data for next week. That ought keep our Economic Barometer all a-flutter. (And did you note last week that September Housing Starts which were to originally have been reported on 17 October, only to be delayed by the government shutdown to 26 November now with the October report have together been further delayed to all come out with the November report on 18 December? What a country!)