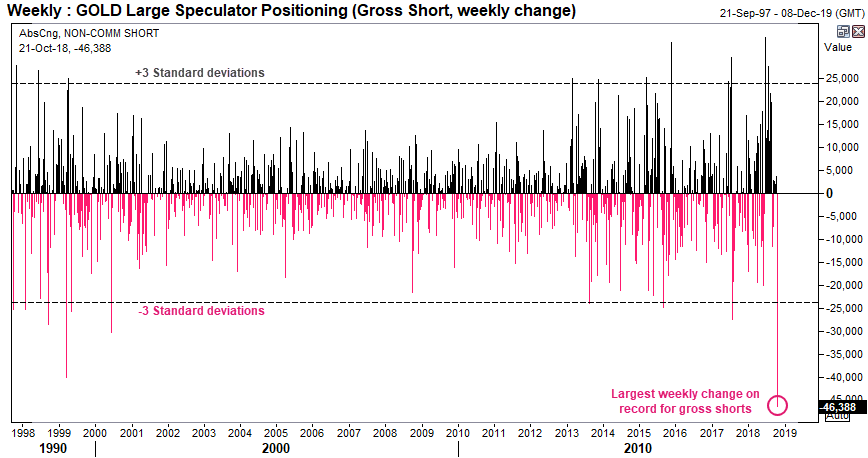
Gold bears closed out of gold by a record amount last week. We’re now watching closely for a follow-through on price.
At the beginning of this month we’d highlighted extreme short positioning on gold and that price action was sending signals of an upside break. Of course, when looking at weekly charts and weighing up the potential for a turning point, patience can be a virtue. But gold’s recent break higher along with rapid short-covering only reinforces this view further.

Focusing on the ‘gross short’ component of the COTS report (commitment of traders), we can see that large speculators closed a record amount of short contracts last week. To see over 46k short contracts removed in one week is no mean feat. To put this into perspective, a -3 standard deviation week sits at -23.7k, and the average weekly change is around 5.6k contracts. In turn, traders are now net-long on Gold for the first time in 9 weeks after racking up their second largest increase of net exposure on record.

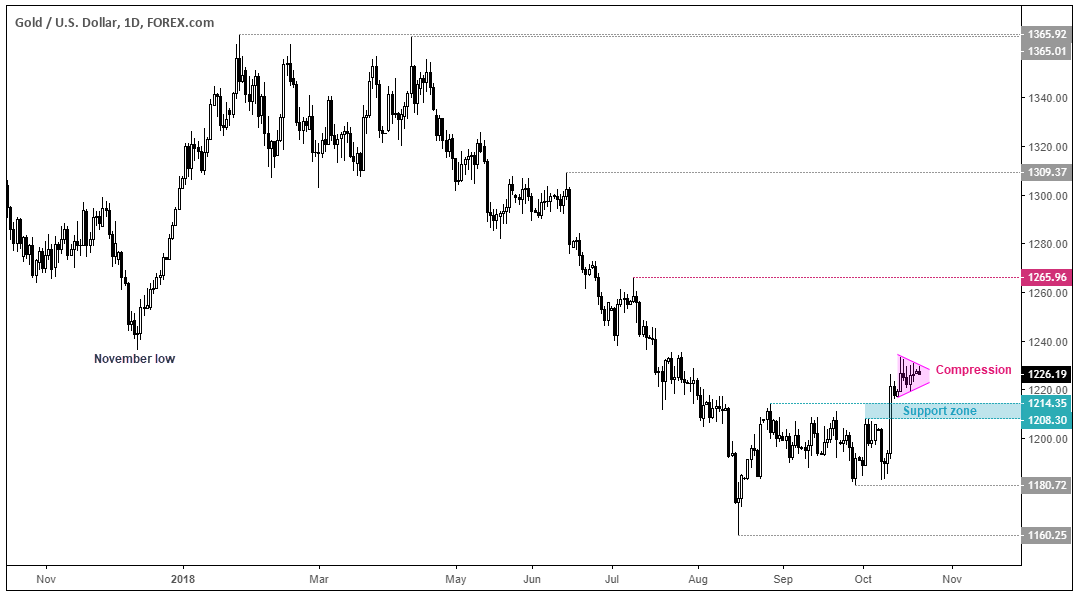
Switching to the daily chart for gold, we see prices are now consolidating above the 1208.30-1214.35 support zone. Price action of last week may not have been as explosive as the shift in speculative positioning, but with prices now compressing after a bullish breakout we’re looking for the next round of volatility to take gold higher. The November low may provide an initial area of resistance, but if we can build a base above the support zone, then the 1265.96 and 1309.37 highs come into focus.
