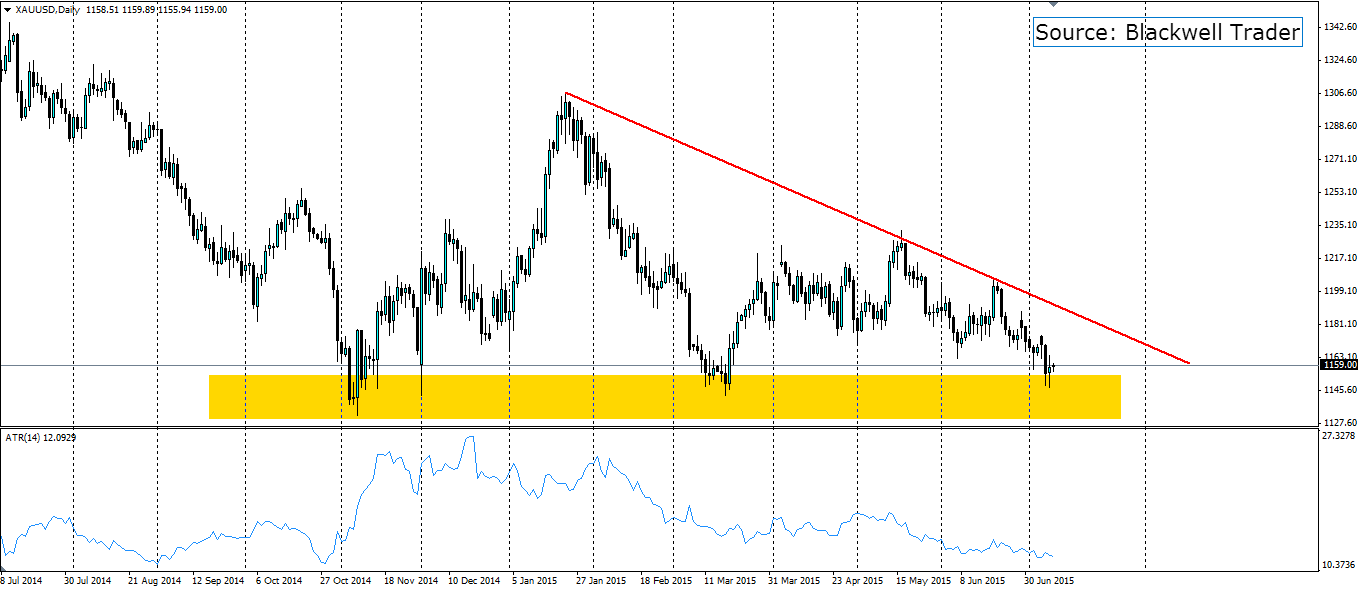
Despite the volatility in global markets at the moment, the gold market has been relatively flat. The last few weeks have seen it trend lower without many big movements. The trend has led gold into a support zone that has seen many swing points over the last nine months and we could be seeing another one forming.

Gold has not played out how one would expect gold to play given the amount of uncertainty and turmoil in global markets over the last three months. The situation in Greece should be enough to send investors fleeing to gold, not to mention the meltdown going on in Chinese equities. But alas, gold has been void of volatility as the ATR on the above chart shows. The downward trend since May has seen the ATR drop to levels not seen since October last year.
The could be about to change, along with the direction of the trend as gold enters the support zone highlighted above. The price has entered this zone on numerous occasions and each time has exited to the upside. This suggests there is plenty of support here and it is an area that gold bulls watch for buying opportunities.

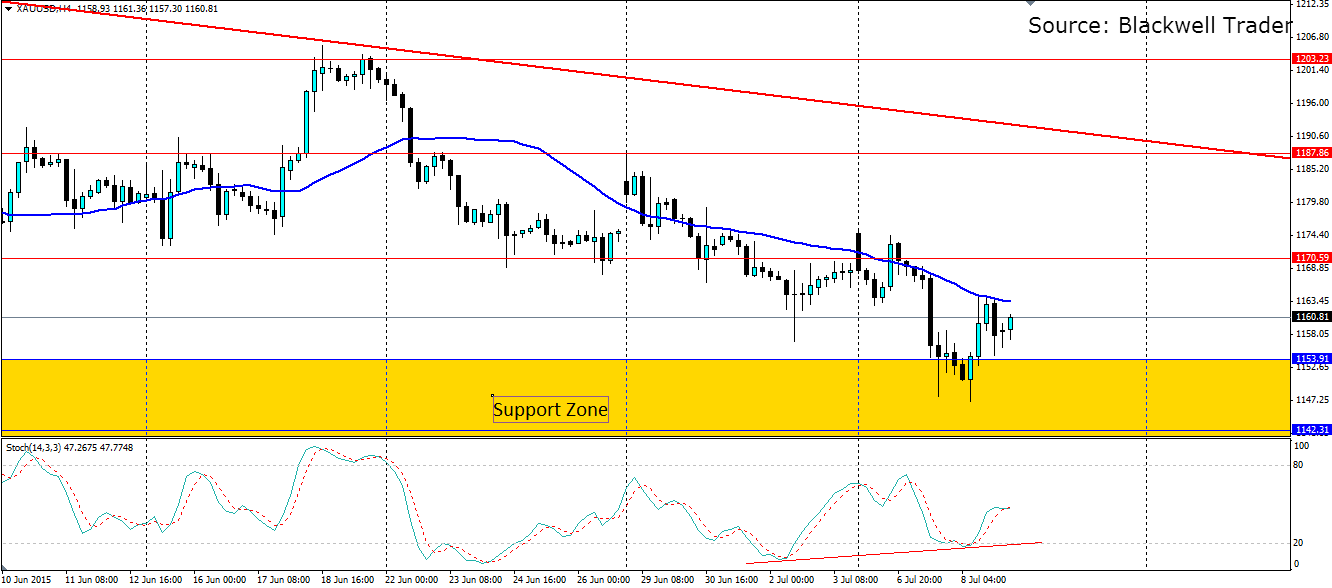
The above chart shows the higher highs that are lifting gold out of the support zone, which suggests the bearish trend may come under some pressure. The Stochastic Oscillator is showing some clear divergence and the price formed a lower swing low, but the oscillator formed a higher low, indicating the sentiment is moving towards the upside.
A move higher is likely to find linear resistance at 1170.59, 1187.86 and 1203.23. Dynamic resistance will also be found at the 30 period moving average on the H4 chart, and the bearish trend line. Support as outlined above is found in the support zone, with linear support at 1153.91, 1142.31 and 1131.88.
