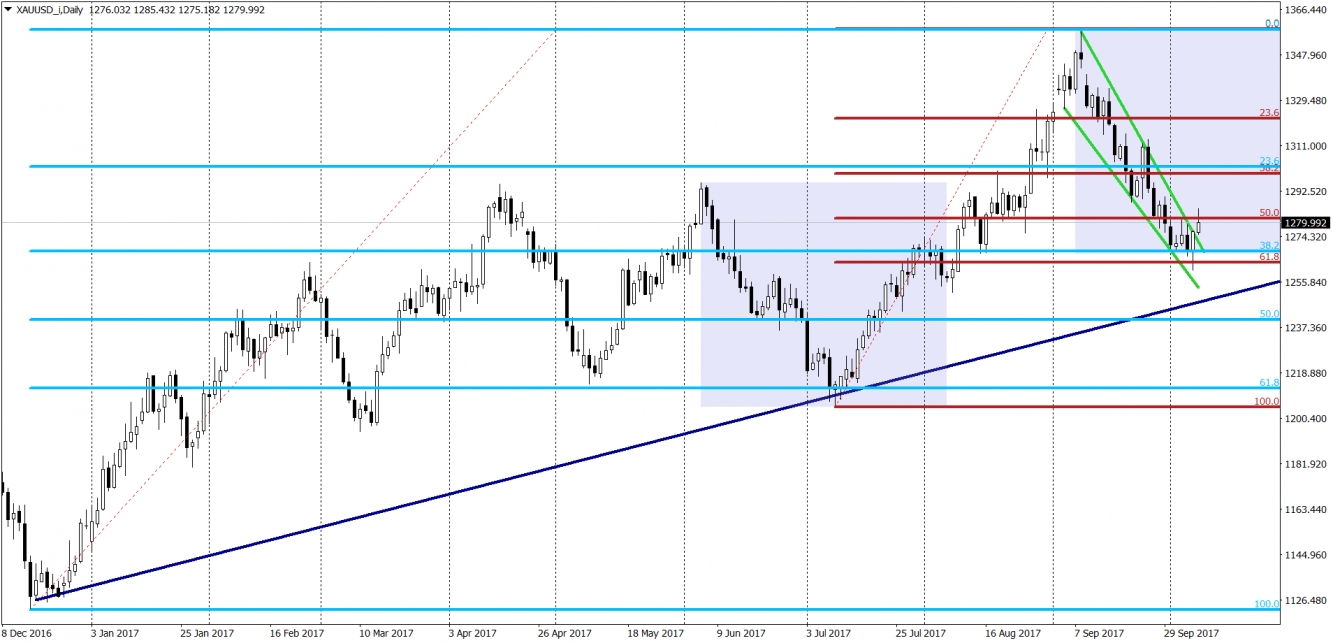
September was not the best month in the history for Gold, actually it was pretty awful. The price reached new yearly highs but after that fell sharply like a rock. October starts a bit better and actually we can see a potential to end the downswing and start the new bullish wave here.
What positive factors can we see on the chart? First of all, we are still in the up trend (above the up trendline, black), so the price is making higher highs and higher lows. What is more, on Friday, thanks to the NFP, the price draw a nice bullish candlestick, which shows us the increasing demand for this precious metal. Crucial here, is the place, where this bounce is happening. Foremost, this support is a combination of the two Fibonacci retracements: 61,8% of the most recent upswing and 38,2% of the main long-term up trend. In addition to that, we have here a correction equality pattern – current correction has the same depth as that one seen in the June-July. Last but not least, we do have a technical formation here - a flag (green lines). Flag is a trend continuation pattern and a breakout of its upper line triggers a buy signal.
As you can see, we do have quite strong combination of bullish factors here. All coming together vastly increase the chances for an upswing. As for the negative factors I cannot see anything significant. Positive sentiment will be denied once the price will break the Friday's lows, which for now seems less probable.
- English (UK)
- English (India)
- English (Canada)
- English (Australia)
- English (South Africa)
- English (Philippines)
- English (Nigeria)
- Deutsch
- Español (España)
- Español (México)
- Français
- Italiano
- Nederlands
- Português (Portugal)
- Polski
- Português (Brasil)
- Русский
- Türkçe
- العربية
- Ελληνικά
- Svenska
- Suomi
- עברית
- 日本語
- 한국어
- 简体中文
- 繁體中文
- Bahasa Indonesia
- Bahasa Melayu
- ไทย
- Tiếng Việt
- हिंदी
Gold ends the correction
Published 10/09/2017, 03:48 AM
Gold ends the correction
Latest comments
Loading next article…
Install Our App
Risk Disclosure: Trading in financial instruments and/or cryptocurrencies involves high risks including the risk of losing some, or all, of your investment amount, and may not be suitable for all investors. Prices of cryptocurrencies are extremely volatile and may be affected by external factors such as financial, regulatory or political events. Trading on margin increases the financial risks.
Before deciding to trade in financial instrument or cryptocurrencies you should be fully informed of the risks and costs associated with trading the financial markets, carefully consider your investment objectives, level of experience, and risk appetite, and seek professional advice where needed.
Fusion Media would like to remind you that the data contained in this website is not necessarily real-time nor accurate. The data and prices on the website are not necessarily provided by any market or exchange, but may be provided by market makers, and so prices may not be accurate and may differ from the actual price at any given market, meaning prices are indicative and not appropriate for trading purposes. Fusion Media and any provider of the data contained in this website will not accept liability for any loss or damage as a result of your trading, or your reliance on the information contained within this website.
It is prohibited to use, store, reproduce, display, modify, transmit or distribute the data contained in this website without the explicit prior written permission of Fusion Media and/or the data provider. All intellectual property rights are reserved by the providers and/or the exchange providing the data contained in this website.
Fusion Media may be compensated by the advertisers that appear on the website, based on your interaction with the advertisements or advertisers.
© 2007-2025 - Fusion Media Limited. All Rights Reserved.

