On Friday the ongoing trade dispute between the US and China was apparently escalated by a notch to the next level, at least verbally. The Trump administration announced a list of tariffs that are supposed to come into force in three week’s time and China clicked back by announcing retaliatory action. In effect, the US government said: take that China, we will now really hurt our own consumers! – and China’s mandarins replied: just you wait, we can hurt our consumers just as badly!
It’s all very sensible – after all, who needs trade? It is well known that mountain caves cut off from all contact with the outside world are the richest places on earth… no, wait. Anyway, ostensibly commodity futures traders took the news as a reason to sell. We don’t really believe it, since they were presented with the same “reason” an estimated umpteen times already and didn’t sell on those previous occasions. Nevertheless, commodities were sold – and the real reason is probably that global growth is turning down quite fast, with leading indicators outside the US recently entering contraction territory.
Gold sold off in sympathy, presumably because precious metals with a significant industrial demand component such as silver and the platinum group metals were hit quite hard. It doesn’t really make a lot of sense, but it should be noted that the relationship between gold and commodities is characterized by ambiguities. They often trend in the same direction – particularly when the USD is weakening – but the economic conditions (or the state of economic confidence) that is bearish for commodities is actually bullish for gold and vice versa. It is ironic that gold has withstood a bearish fundamental backdrop for quite some time and is now actually selling off on developments that would normally be considered bullish rather than bearish.
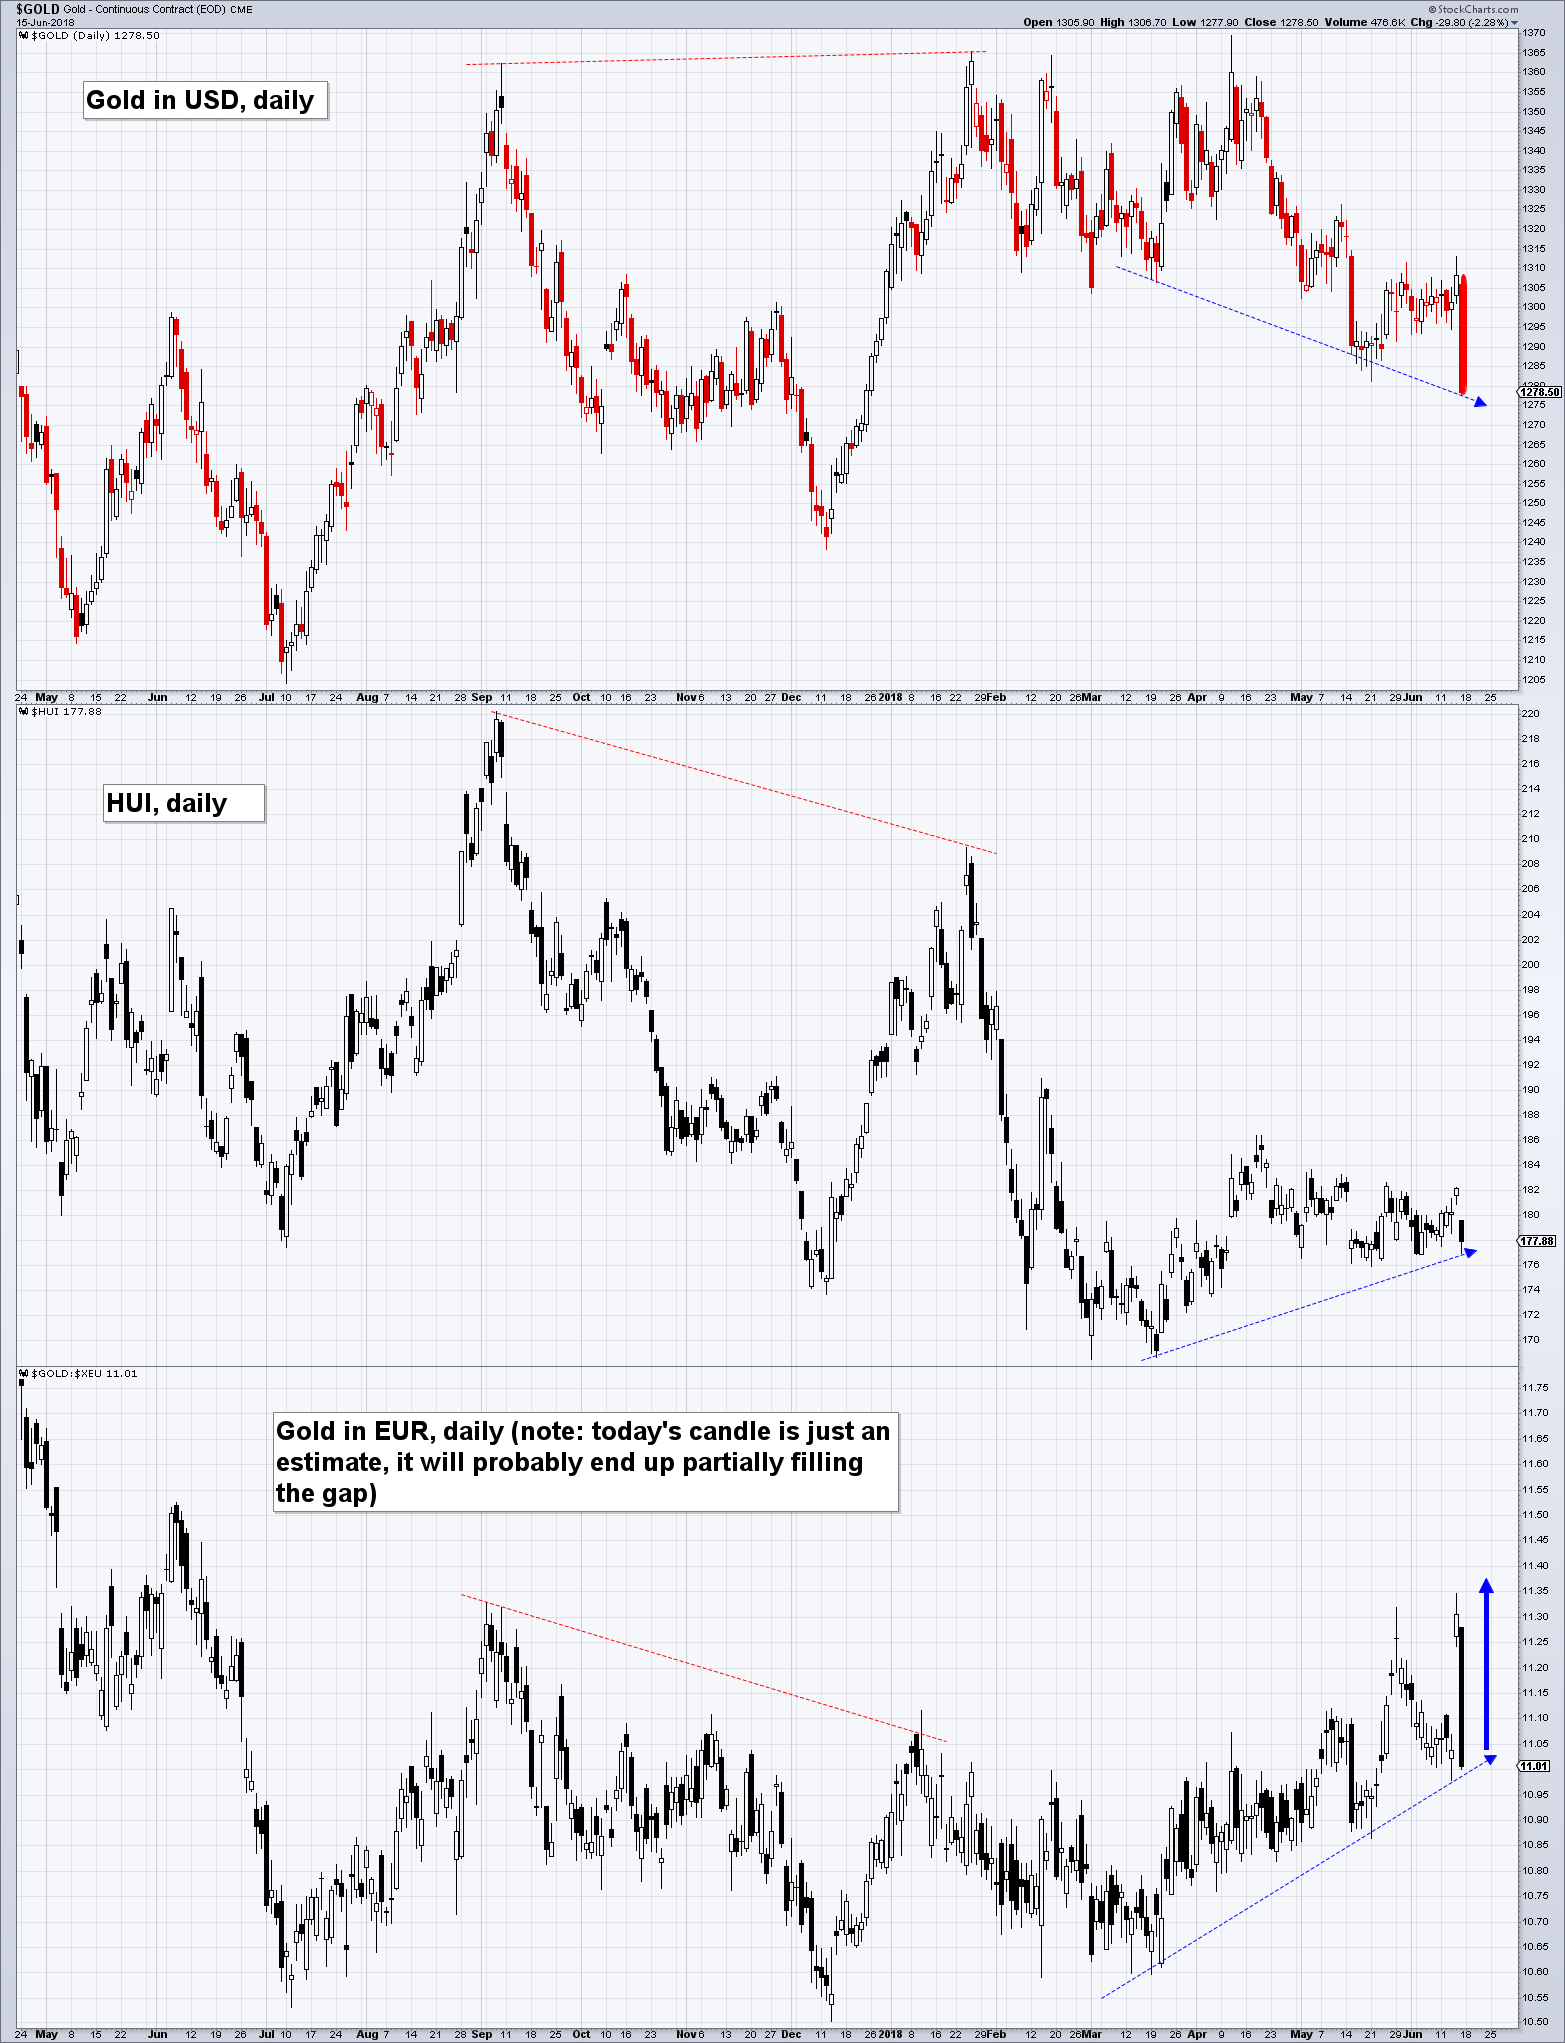
Whatever the reasons for the selling, we prefer watching for technical clues, since we can never know with certainty which underlying fundamental drivers will be assigned the greatest weight by market participants. The gold market continues to look intriguing on that basis – this seems a good time to pay attention and prepare for a potential trend change. The reason is that a number of potentially positive divergences are beginning to show up (while the highs earlier this year were marked by bearish divergences).

The chart above compares the gold price in USD to the HUI Index and gold priced in euro. The red dotted lines indicate the large bearish divergences put in after the seasonal rally beginning in December, the blue dotted lines indicate the bullish divergences which have emerged recently.
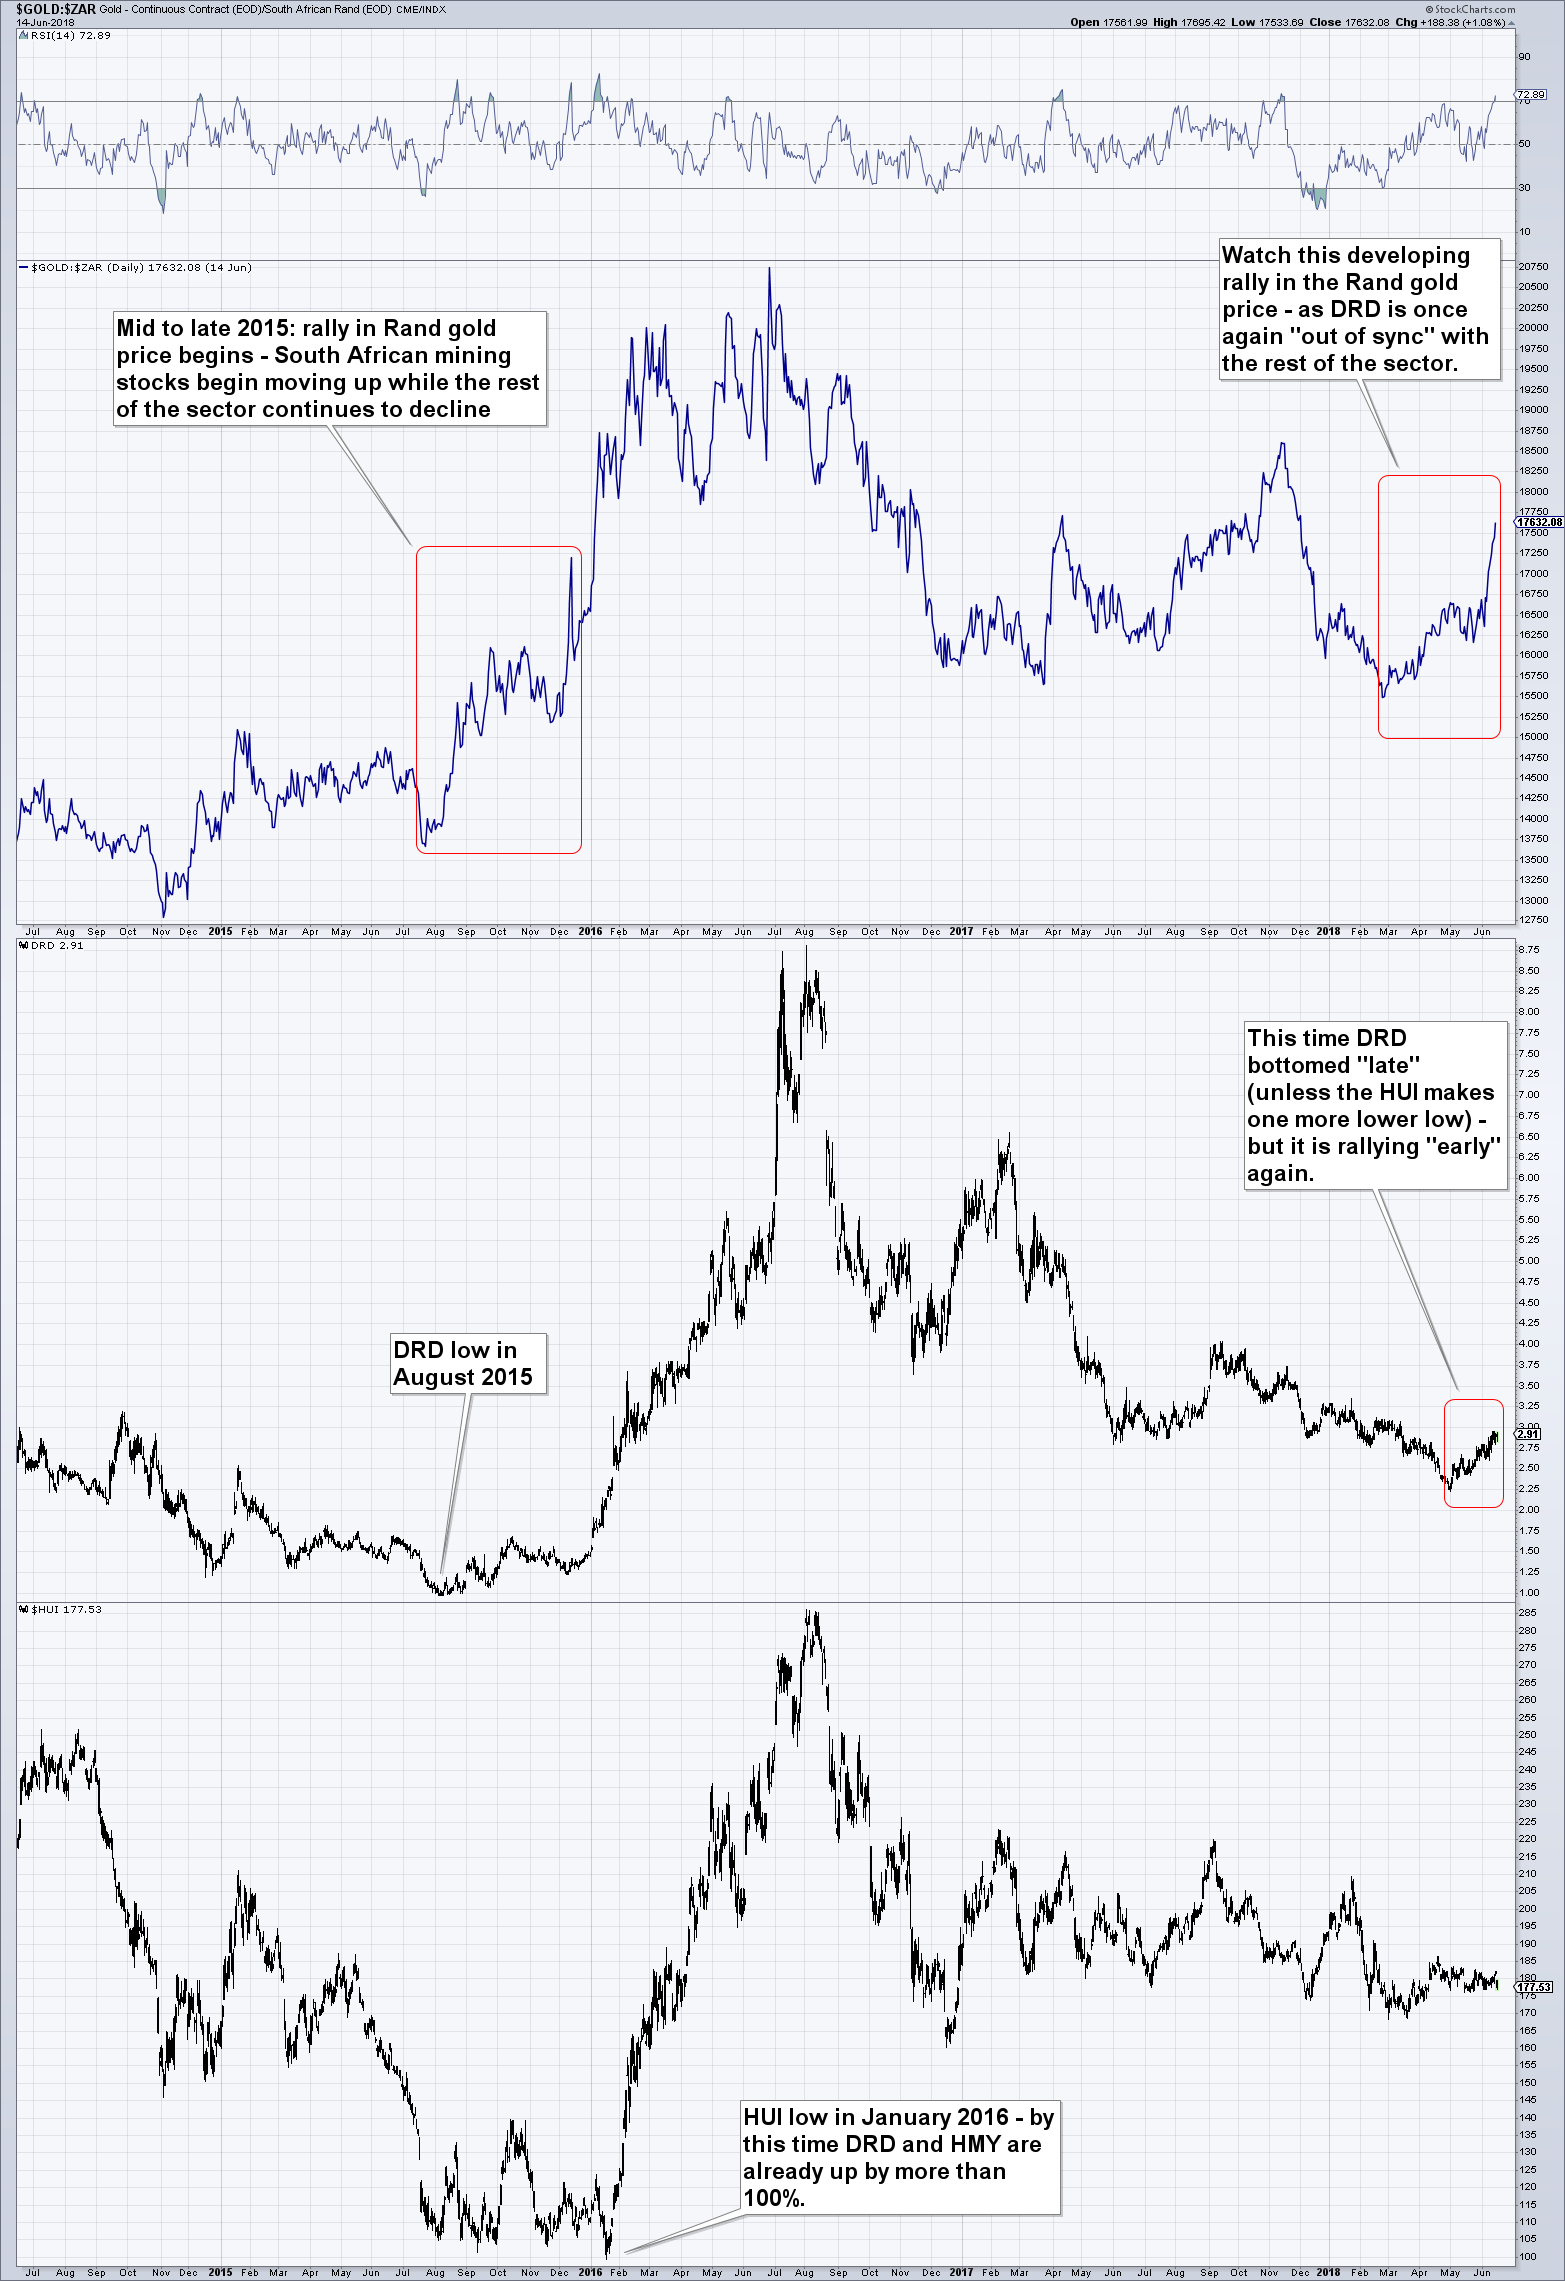
Obviously, divergences can always be erased – but the larger they are, the less likely that becomes. “Large” refers both to their extent and the amount of time consumed in creating them. The most recent divergences and signals are not firmly established yet, but they have potential, which is why we point them out. Readers may remember that we inter alia wrote about a certain “canary in the gold mine” in late 2015 (also a good time to pay attention to the sector). An analogous development seems to be underway at present:

The stocks of South African gold mining companies, such as Randgold Resources (NASDAQ:GOLD), which derive the bulk of their earnings from domestic operations are quite a useful early warning indicator near meaningful lows. Note that “near” sometimes means that one still has to be patient for months – but the lead time is by no means fixed. Here we compare moves in the Randgold price to DRDGOLD Limited (NYSE:DRD) (which generates its entire income in SA) and the HUI Index – note what happened in late 2015 and what has begun to happen recently. We should not necessarily expect an exact replay of the 2015 pattern (or the 2001/2002 pattern for that matter), but this is definitely a signal with strong potential.
In case you are wondering why we show DRD but not Harmony Gold Mining (NYSE:HMY), the latter is currently subject to company-specific developments which are weighing on its stock price – namely a share placement to fund the recent Moab Khotsong acquisition. Amazingly the stock has sold off for the second time on the same news, despite the fact that the placement was only half as big as originally feared. HMY lagged in 2015 as well, but it eventually followed the lead of DRD and not only caught up with it, but quickly overtook it (the gold price leverage of HMY is even more pronounced).
Similar to the divergences shown in the first chart, one has to keep in mind that the Randgold price-related signal is quite recent and not fully developed yet. In other words, follow-through is needed, which would be provided by the Randgold price exceeding its late 2017 peak near ~ZAR 18,600 per ounce, preferably confirmed by the prices of SA-based gold stocks.
There is actually a good reason why the Randgold price and SA gold stocks fairly often lead the USD gold price and the HUI near major lows: rate hike campaigns by the Fed often affect emerging market economies before they affect the US economy. This is especially relevant for developing countries that have incurred a lot of dollar-denominated debt and/or are sporting large current account deficits. Significant pressure on the most vulnerable EM currencies and risk assets tends to emerge regularly in these situations.
This time the Argentine peso and the Turkish lira have been hit the hardest (incidentally the Argentine currency was in focus at the turn of the millennium as well). The problem for investors is that most EM currencies are not particularly liquid and are often subject to sizable central bank intervention and various restrictions designed to fend off “evil speculators”.
The rand is a laudable exception, as the South African central bank deliberately eschews intervention in foreign exchange markets. As a result the rand has much better liquidity than most other EM currencies – which makes it an attractive indirect hedging instrument when the latter come under pressure. Hence accelerating weakness in the rand will often develop as crisis conditions in the EM space intensify.
However, this is invariably also the prelude to a trend change in the US dollar. The same liquidity squeeze that affects emerging markets will eventually hit the US economy with a lag, which in turn will prompt the Fed to reverse course. The gold price in USD terms usually turns up in advance of the associated peak in the dollar index. This is in a nutshell the reasoning behind the idea that the sub-sector of South African gold mining stocks is useful as a leading indicator for the sector as a whole.
Keep in mind the caveat that what has worked in the past won’t necessarily work in the future – but in this case we can point to several historical examples at important junctures and the idea is underpinned by what we think is fairly sound reasoning.
Seasonal Trends May Be Helpful This Time
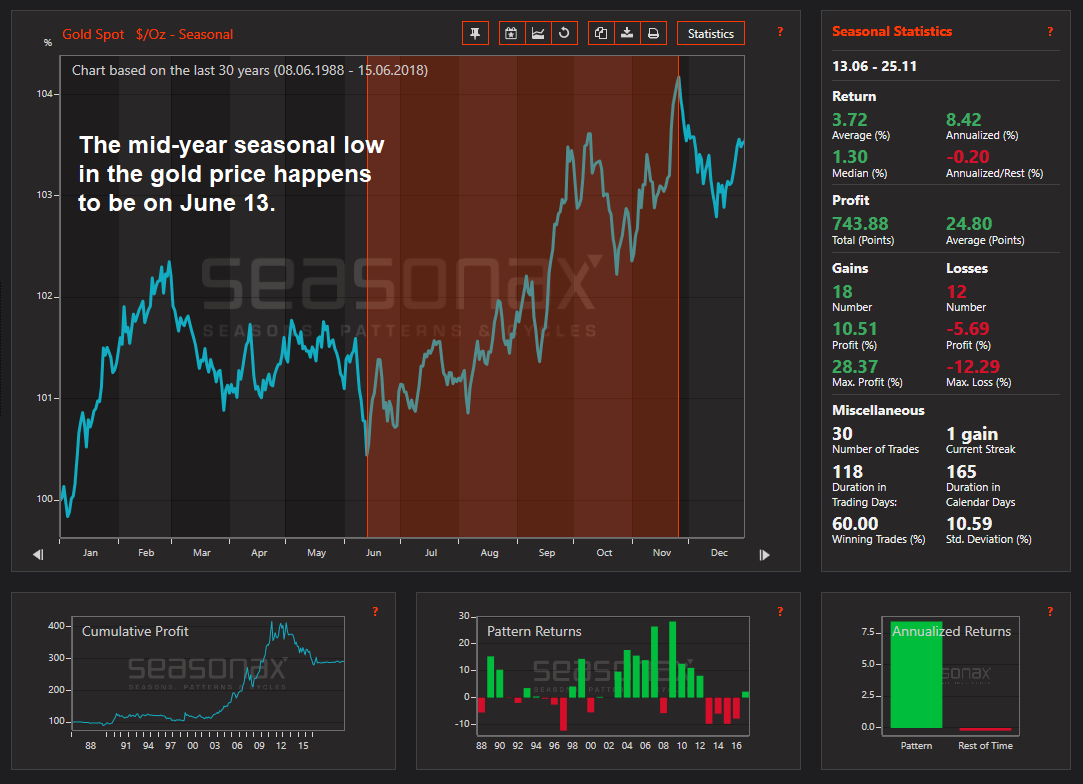
The 30-year seasonal chart also suggests that it is time to pay close attention to the gold market. As it happens, the seasonal mid-year low is on June 13 (the high of the subsequent seasonally strong period is on November 18). It should be pointed out that the seasonally strong period has produced positive returns in just 60% of the cases over the past three decades (in USD terms).
In the recent gold bear market the results were particularly disappointing, with negative returns seen in four consecutive years (2013 – 2016). 2017 was the first year since 2012 when a positive return was recorded again. Nevertheless, the returns in positive years were so large that a quite respectable annualized return of 8.42% was achieved on average. Given the unusual 4-year streak of negative returns prior to 2017 it may actually be time for an offsetting streak of positive returns (note that in the past the seasonally strong period frequently generated positive returns even in bear markets).

Gold, 30-year seasonal chart (made with the Seasonax app on Bloomberg). The statistics all refer to the seasonally strong period highlighted in red. Obviously seasonal gains are more likely to be seen in bull markets than in bear markets, but there were notable exceptions such as the late 1980s and late 1990s when the period was profitable in bear market conditions as well. The average annualized return is sizable and beats the return made in the rest of the time handily (negative -0.20% annualized). Long negative streaks are often followed by long positive streaks.
We don’t know yet how this year will turn out, but we have noticed that the gold sector quite often bottoms either in the May/June time window, or failing that, close to the time of the seasonal peak in November-December (an example of cycle inversion – this happened last in 2016, when the annual high occurred in late July, 6 weeks after the usual seasonal low. The rally had started around 6 weeks after the usual seasonal peak). Note that this also refers to long term tendencies – it certainly doesn’t work that way every year.
Luckily there is little risk involved with betting on a positive outcome. The recent low in the HUI at around 169 points is only ~nine points below its current level – by using this low as a stop loss level, one can keep risk at a minimum. Keep in mind that well-defined support levels are sometimes subject to false breaks, such as the one seen in January of 2016.
If one is booted out of a position due to a false break one has to be prepared to immediately reenter the market once this becomes obvious, as false breaks are particularly bullish signals (as evidenced by the 180% surge following the early 2016 break). In short, the sector has to be approached with a mixture of patience, discipline and flexibility.
Unfortunately false starts are a lot more common than false breaks, but we believe focusing on the gold sector on junctures such as the current one is worth the effort, as very few market sectors are capable of delivering comparable returns in such compressed time frames. This is a function of the sector’s small size and high leverage to the gold price, which magnify the boom-bust cycles associated with it.
