I wanted to offer some thoughts on Gold on this Thanksgiving weekend as Gold has reached a key price pivot and has seen sizable selling in recent weeks as the rest of the market continues to melt into the stratosphere and speculative bubbles are spreading across asset classes.
So why not Gold?
There are multiple factors at play: The more obvious is that market participants thought Gold to be a safety hedge in an uncertain world and with Covid vaccines being announced weekly that uncertainty is being priced out of the market and the safety hedges unwound.
Yet Gold has also been presumed to be a central bank currency printing trade as the dollar is being pounded into the ground. That correlation worked all year but has stopped working as both dollar and Gold have been dropping together lately and that has to be a concern for Gold longs. If Gold can’t rally with the dollar dropping then when can it rally?
This is where technicals are coming in and they suggest a key time for Gold.
Now those that are following our market videos know I’ve been cautious about Gold ever since the target got hit in the summer:
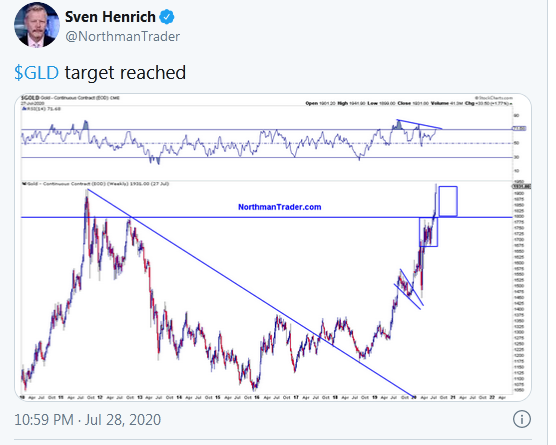
The main reason being technical, once targets are reached and charts show negative divergences I’m of the mindset to sit back and wait for new chart patterns to evolve.
As market video subscribers know I’ve been watching key patterns that could suggest there is a Gold buying opportunity here.
Firstly, the most obvious chart aspect is the support of the 200MA which probably most people are watching, also in the context of bullish falling wedge/bull flag that has formed:
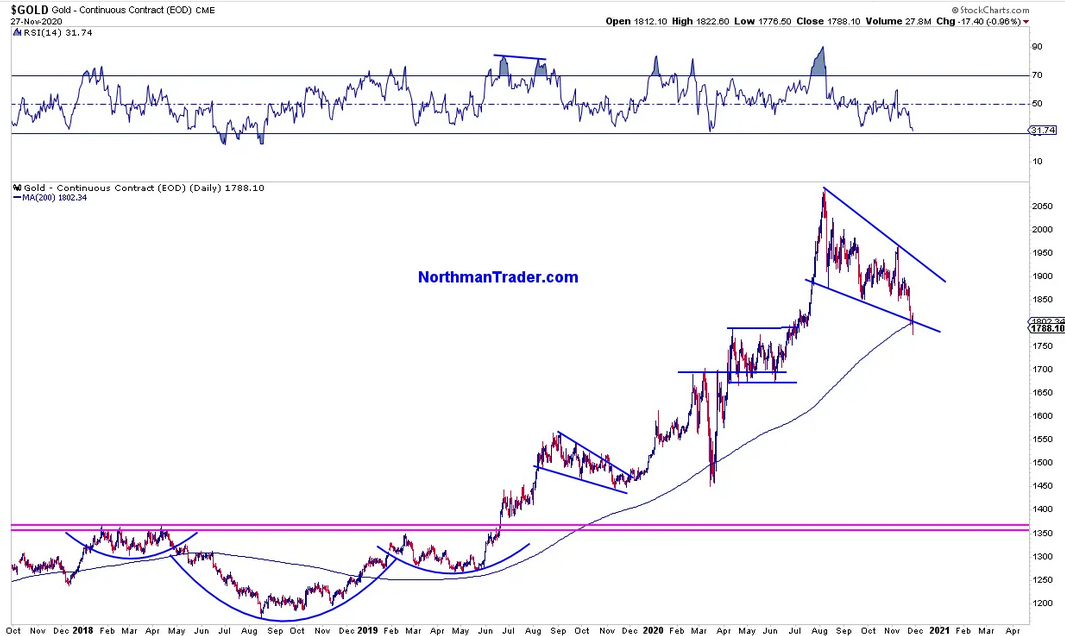
Note this pattern was challenged late last week, but also note Gold has been following one bullish pattern after another which we identified ahead of time in 2019.
So Gold continues to follow bullish patterns, also note Gold is becoming oversold but also has room to become more oversold.
What’s more interesting to me here is how Gold has precisely reached the retrace target zone I’ve been outlining in the market videos since the summer, the .382 fib along with the 2012 bounce highs as support:
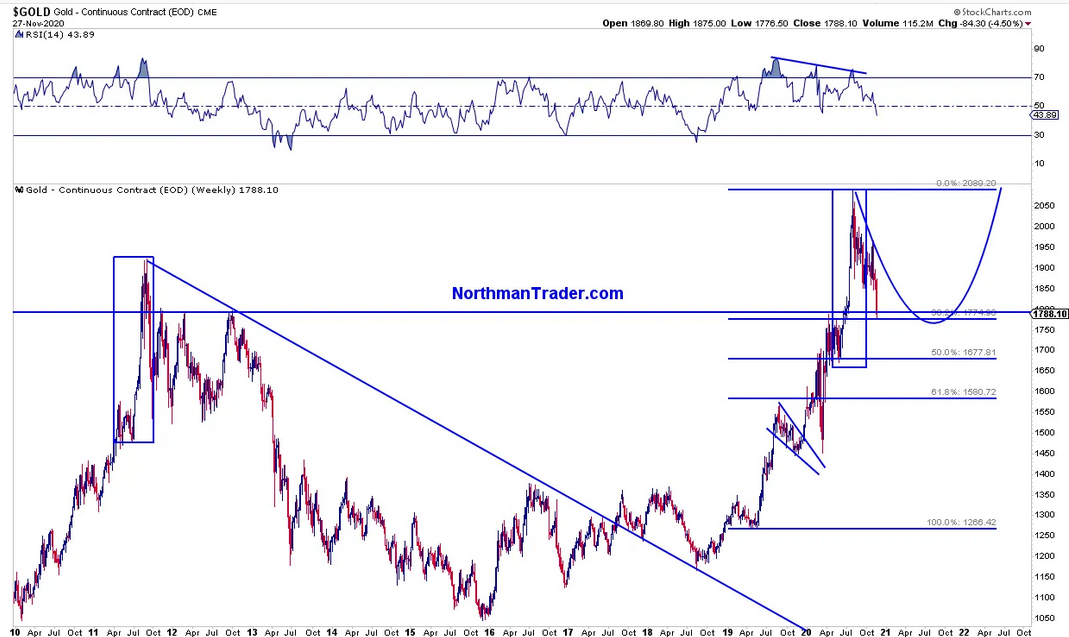
That is confluence support and holding this confluence zone would support the notion of this corrective move in Gold off of the weekly negative divergence having the opportunity to build a larger cup and handle pattern which would be tremendously bullish Gold long term for a target north of $3,000.
I need to outline two caveats here.
First, note how similar the rip rally in 2020 is to the one of 2011. That period was followed by a steep correction similar to the current one. Gold then chopped up and down in price for 2 years before finally dropping to the 2015 lows. The similarity of the structure certainly leaves room for a similar outcome. One argument to support such a price development is to say that incremental central bank intervention will be diminishing in the years to come. They went all in this year and there are frankly less assets for them to buy, certainly in comparison to the magnitude they bought in the short time period in 2020.
Second, and this goes to my earlier point: Watch the US dollar:
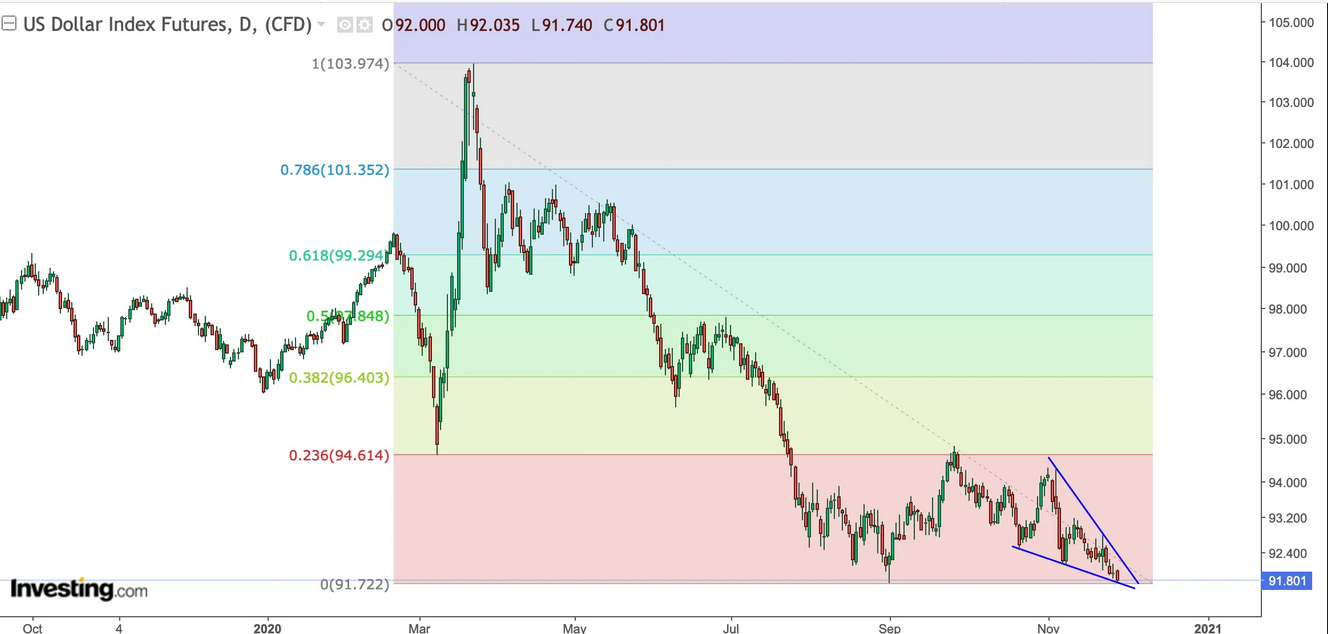
Gold should’ve been able to take advantage of the recent dollar weakness, but hasn’t been able to. That’s a concern. Note Gold peaked in the summer near the time when the dollar bottomed. Now the dollar is retesting these lows with a potential falling wedge which could play as bullish pattern and firm as a potential double bottom.
If Gold can’t rally with a falling dollar how will it cope with a potential rising dollar? As the dollar has yet to show strength it is an academic question at the moment, but it’s something to keep a watchful eye on it as correlations are to be viewed with extreme caution at the moment.
Let’s not forget: We are inside the largest asset bubble of all time:
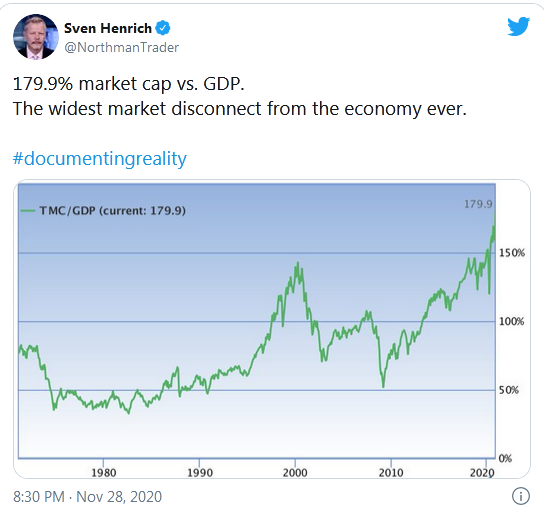
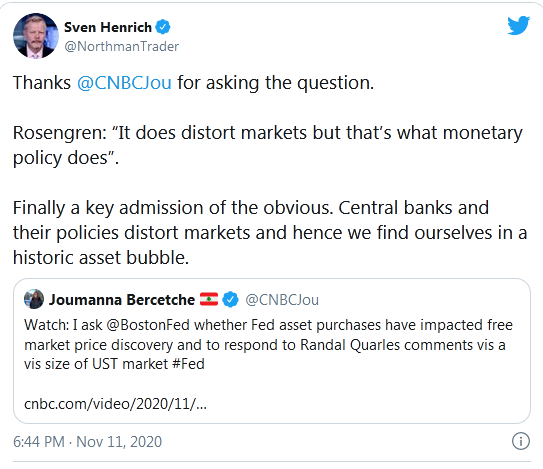
Distortions having been created that central bankers are fully aware of, but rarely admit. But when they do one best pay attention:
Distortions brought about by the loosest financial conditions in history:
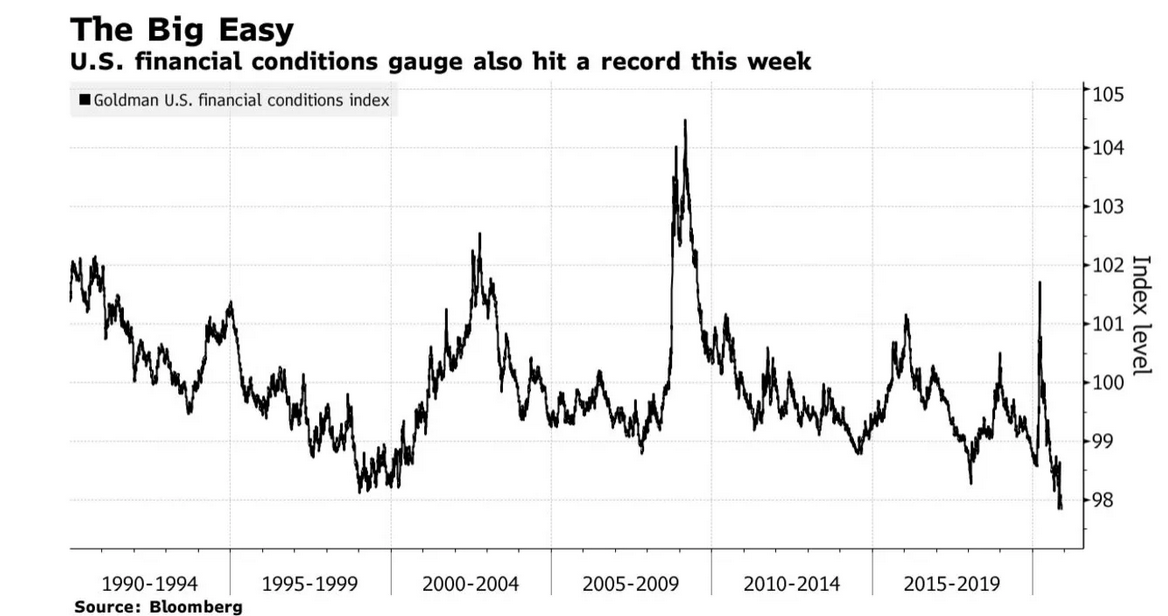
Pedal to the metal risk on. Except in Gold in recent months.
Bottom line: Gold has continued to follow technicals beautifully and the recent weakness is no surprise to those that have followed the technical chart structures. Now Gold has reached key confluence support and has the opportunity to rally from this support. But the caveats need to be watched and risk-managed as we live in times of broad market correlations having been mercilessly attacked by central bankers and their policies.
