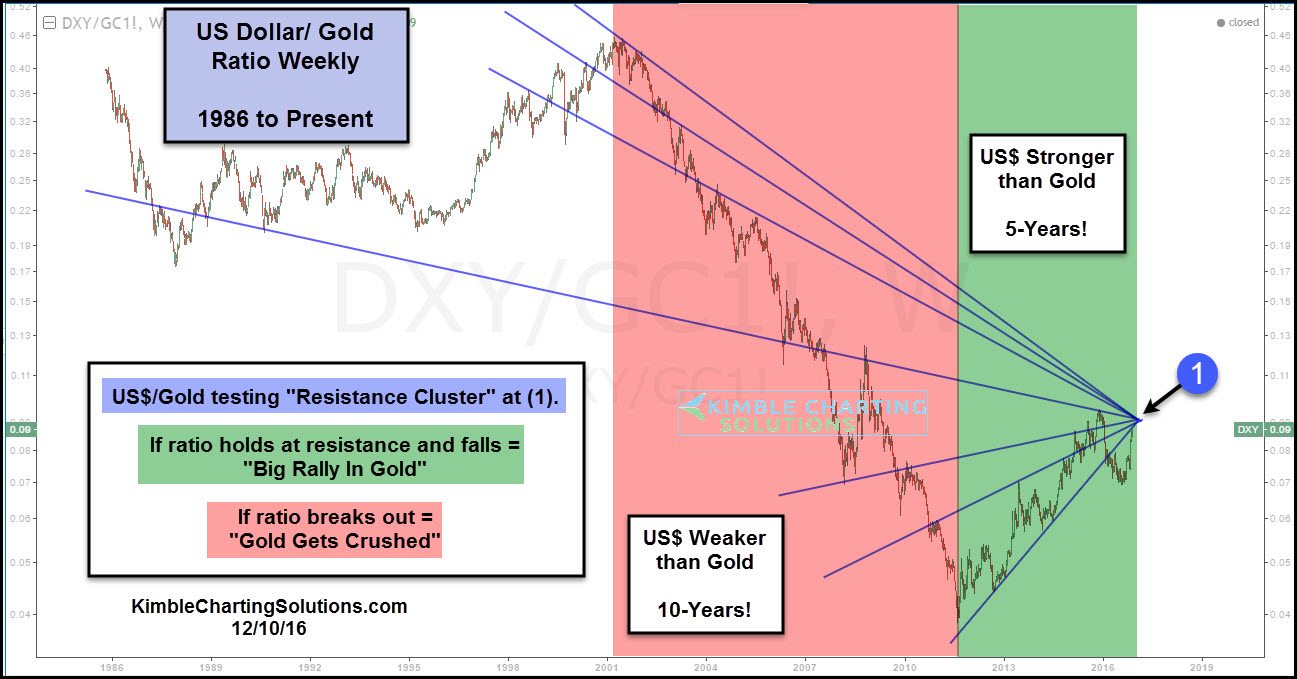
The chart below looks at the US dollar/Gold Ratio over the past 30-years. When the ratio is heading lower, USD is weaker than Gold/Gold stronger than USD. When the ratio is heading higher, USD is stronger than Gold/Gold weaker than the USD.
At this time, the ratio in the chart below, has created a Power of the Pattern setup, that is seldom if ever seen.

A rare cluster of resistance is in play for the USD/Gold ratio at (1). Resistance is resistance until broken. If this resistance would hold and the ratio would turn lower, Gold could blast off, which would benefit Gold, Silver and Mining stocks.
What do Gold, Silver and Mining bulls NOT want to see happen? If the cluster of resistance is taken out to the upside (USD stronger than Gold), metals could get crushed.
