There was little change in this week’s Commitments of Traders report when it came to the positioning of traders within the gold futures market.
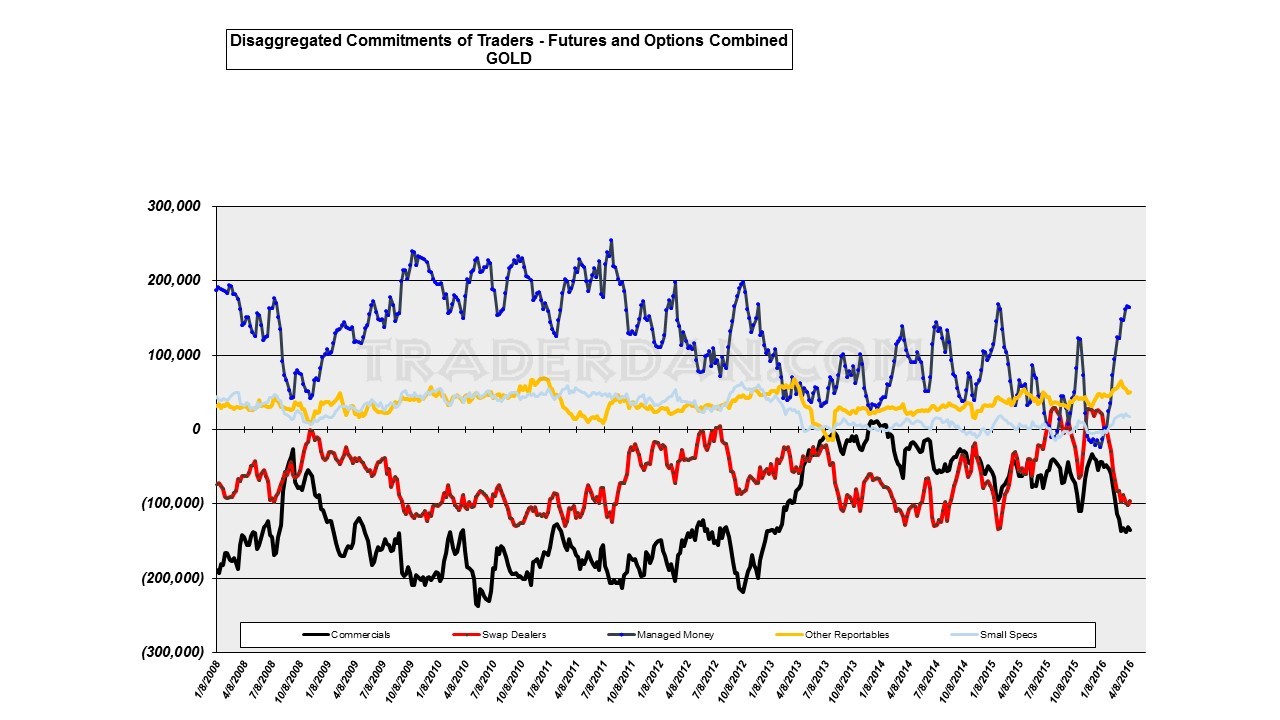
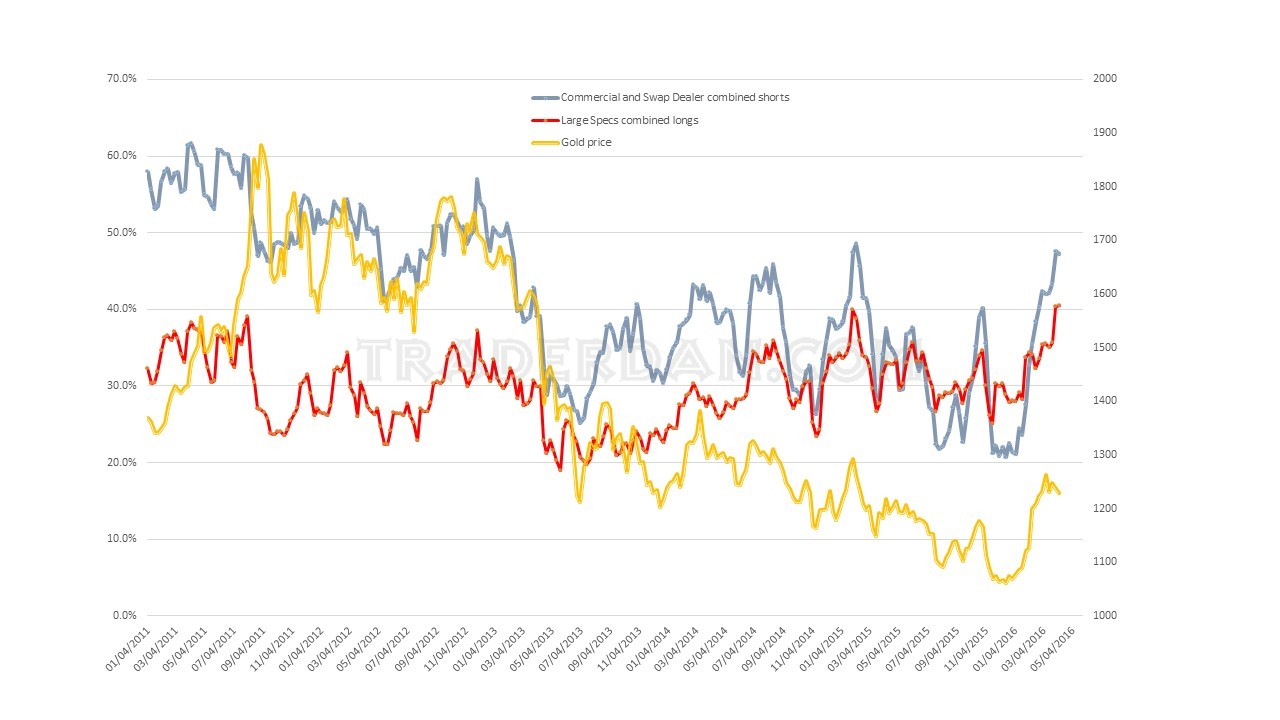
Here is an updated chart reflecting the current composition.
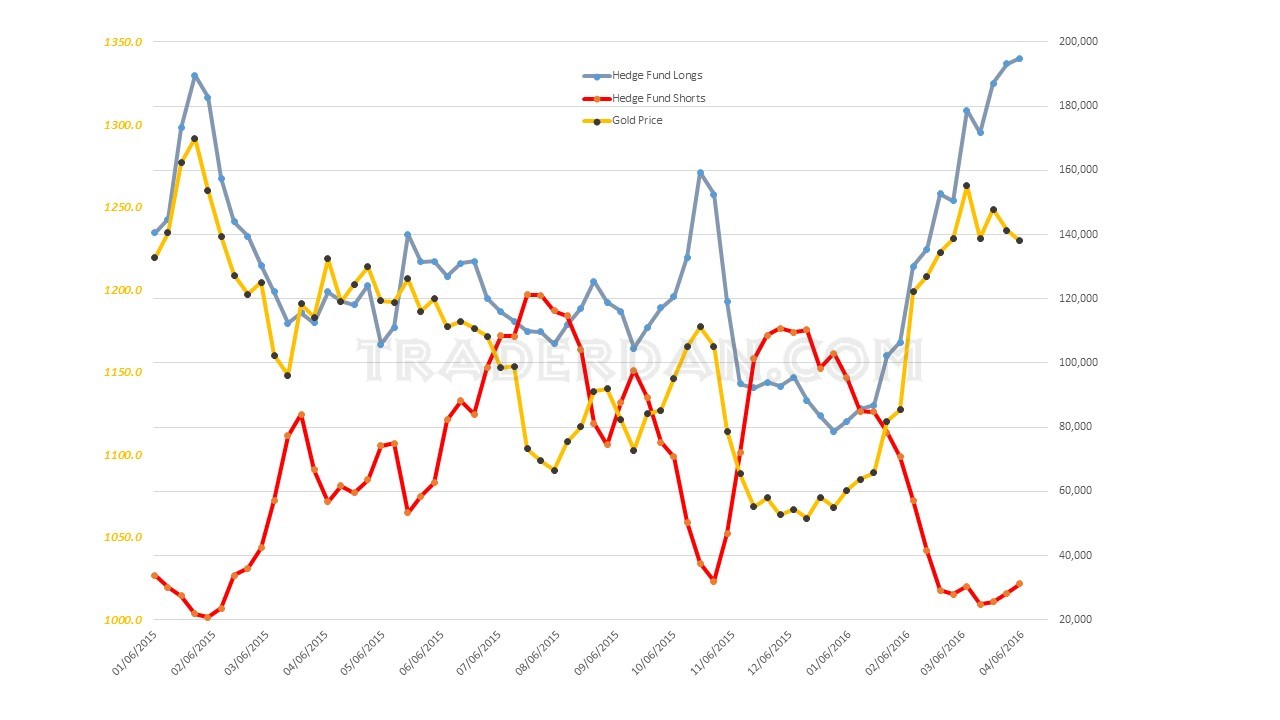
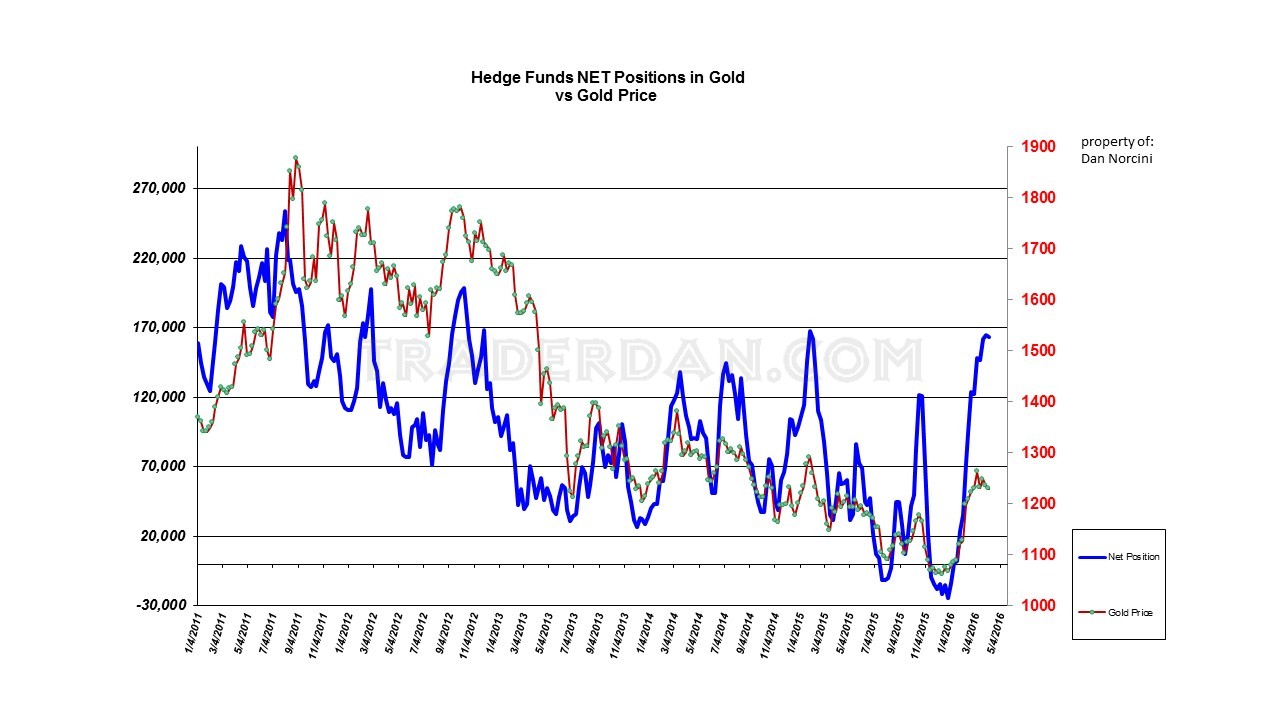
Hedge funds both slightly increased overall outright long positions and outstanding outright short positions with the result that their overall NET LONG position did slightly DECREASE as more new shorts were added than new longs.
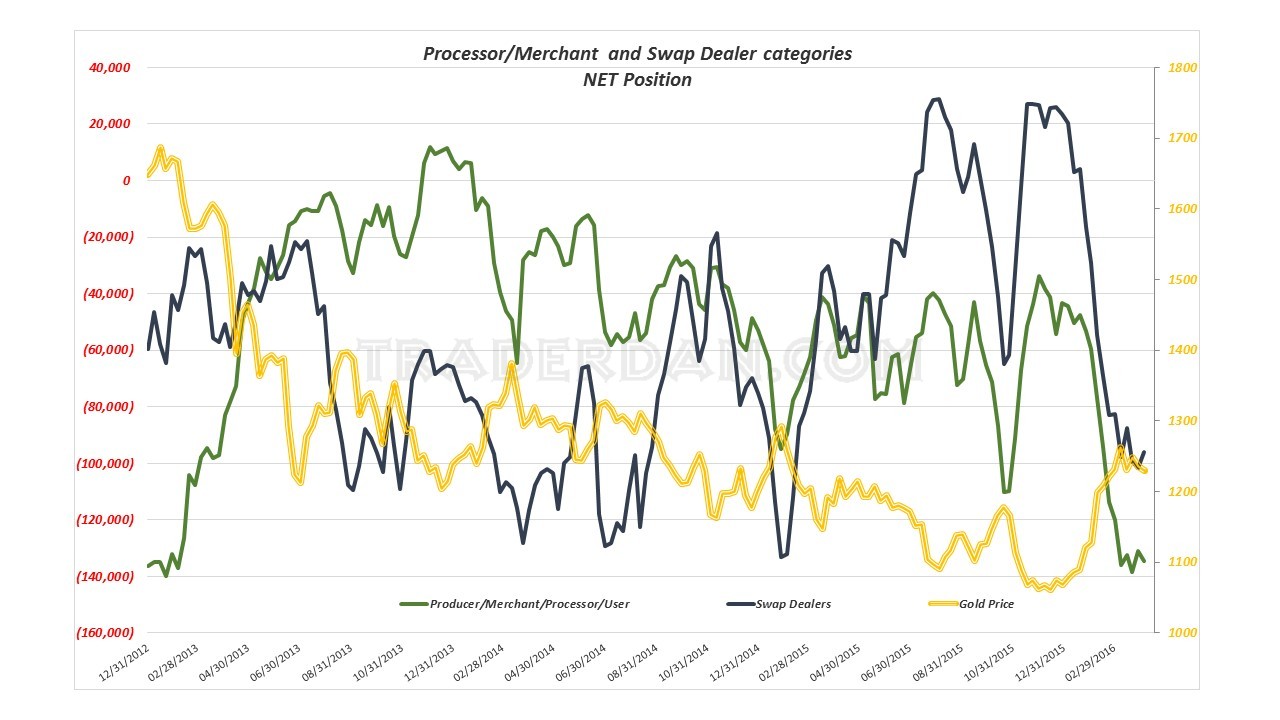
On the Commercials side, their overall NET SHORT position slightly increased while the Swap Dealer net short position slightly decreased. Together it was essentially a wash.
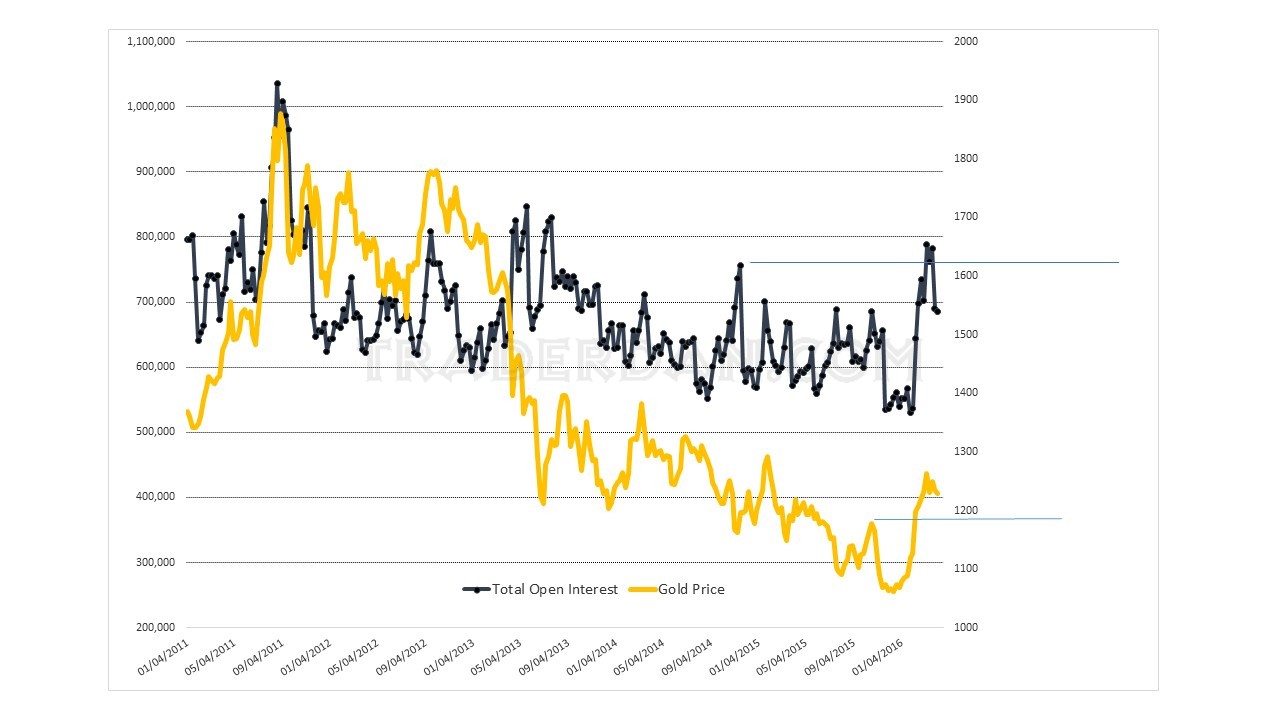
Total open interest (futures and options combined) declined overall, something which the bulls will want to see reverse sooner rather than later.
On a percentage basis, the total number of outright longs held by LARGE SPECULATORS ticked up slightly while the total number of combined commercial and swap dealer outright short positions declined slightly. Both readings remain at relatively high levels.
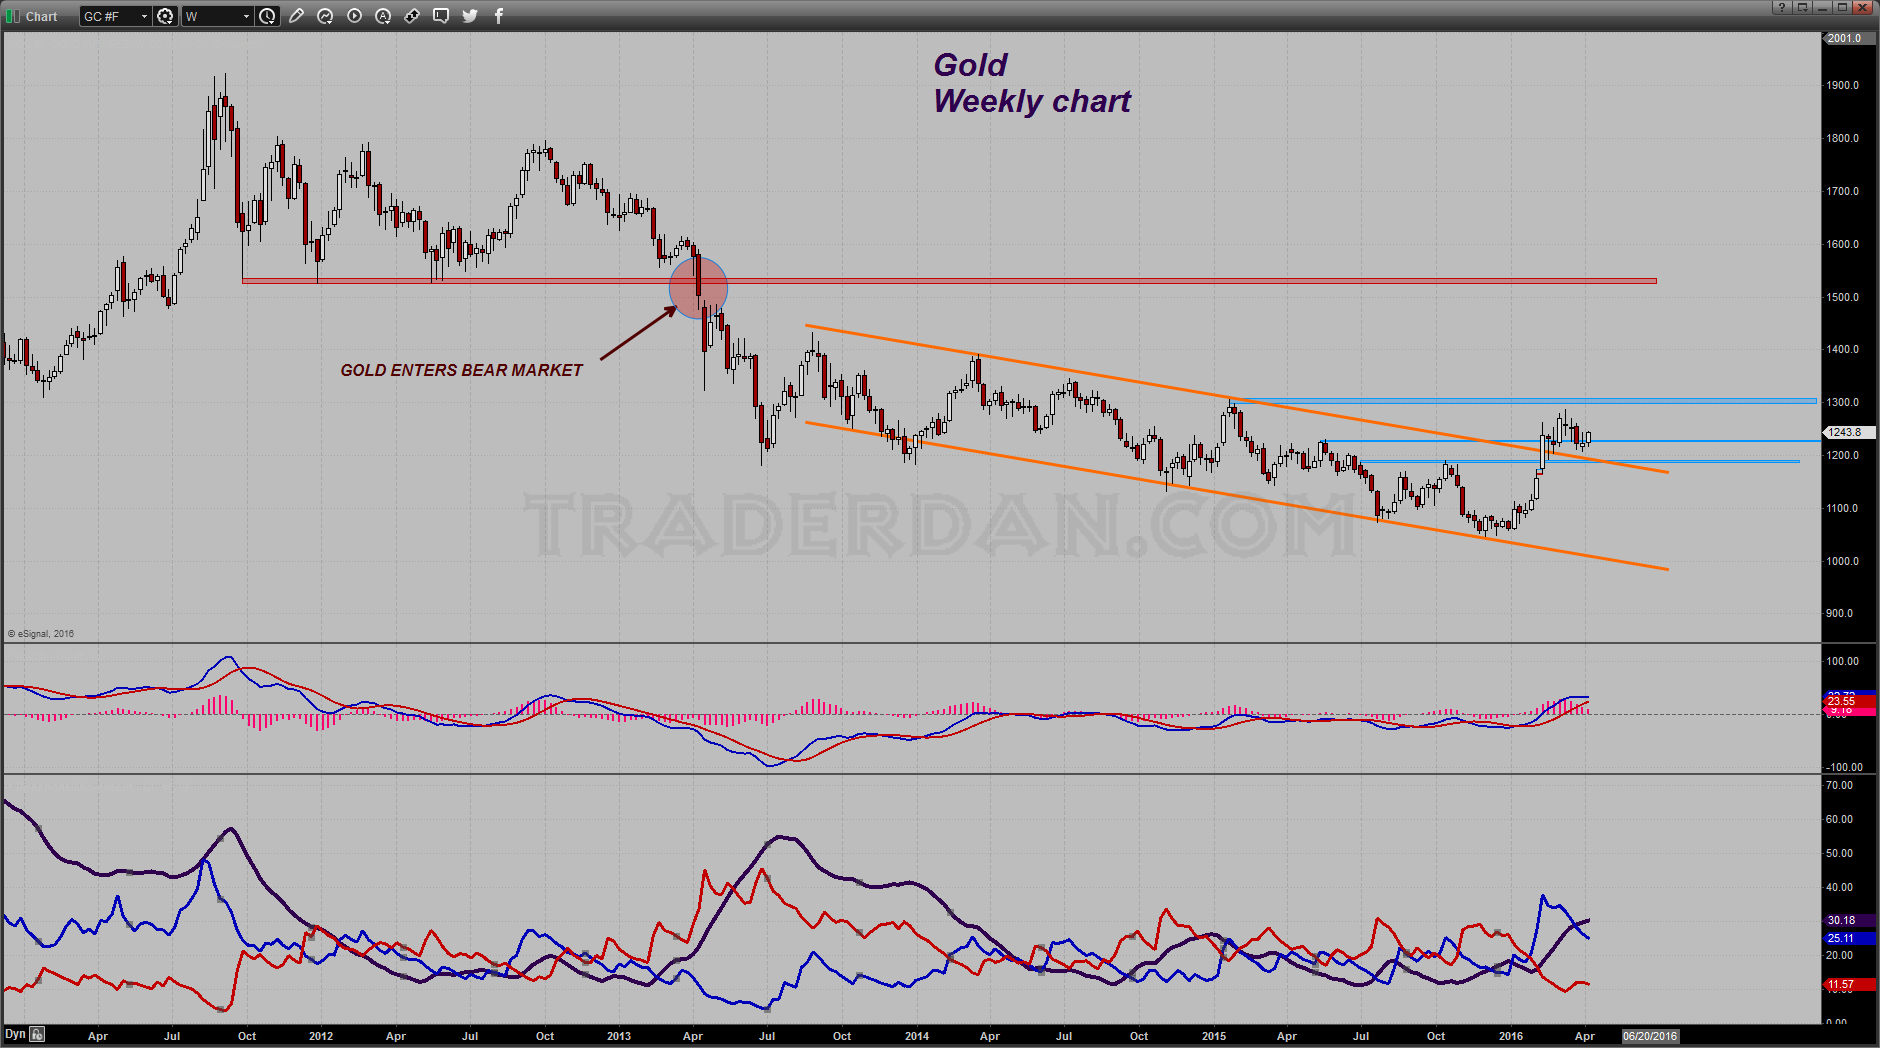
On the weekly chart, there was little change in price movement when viewed from a larger perspective. Gold remains ABOVE the former descending price channel with price having moved down to retest the upper trendline only to find buying support. The $1285-$1300 overhead resistance zone is the notable barrier to further upside potential at this juncture.
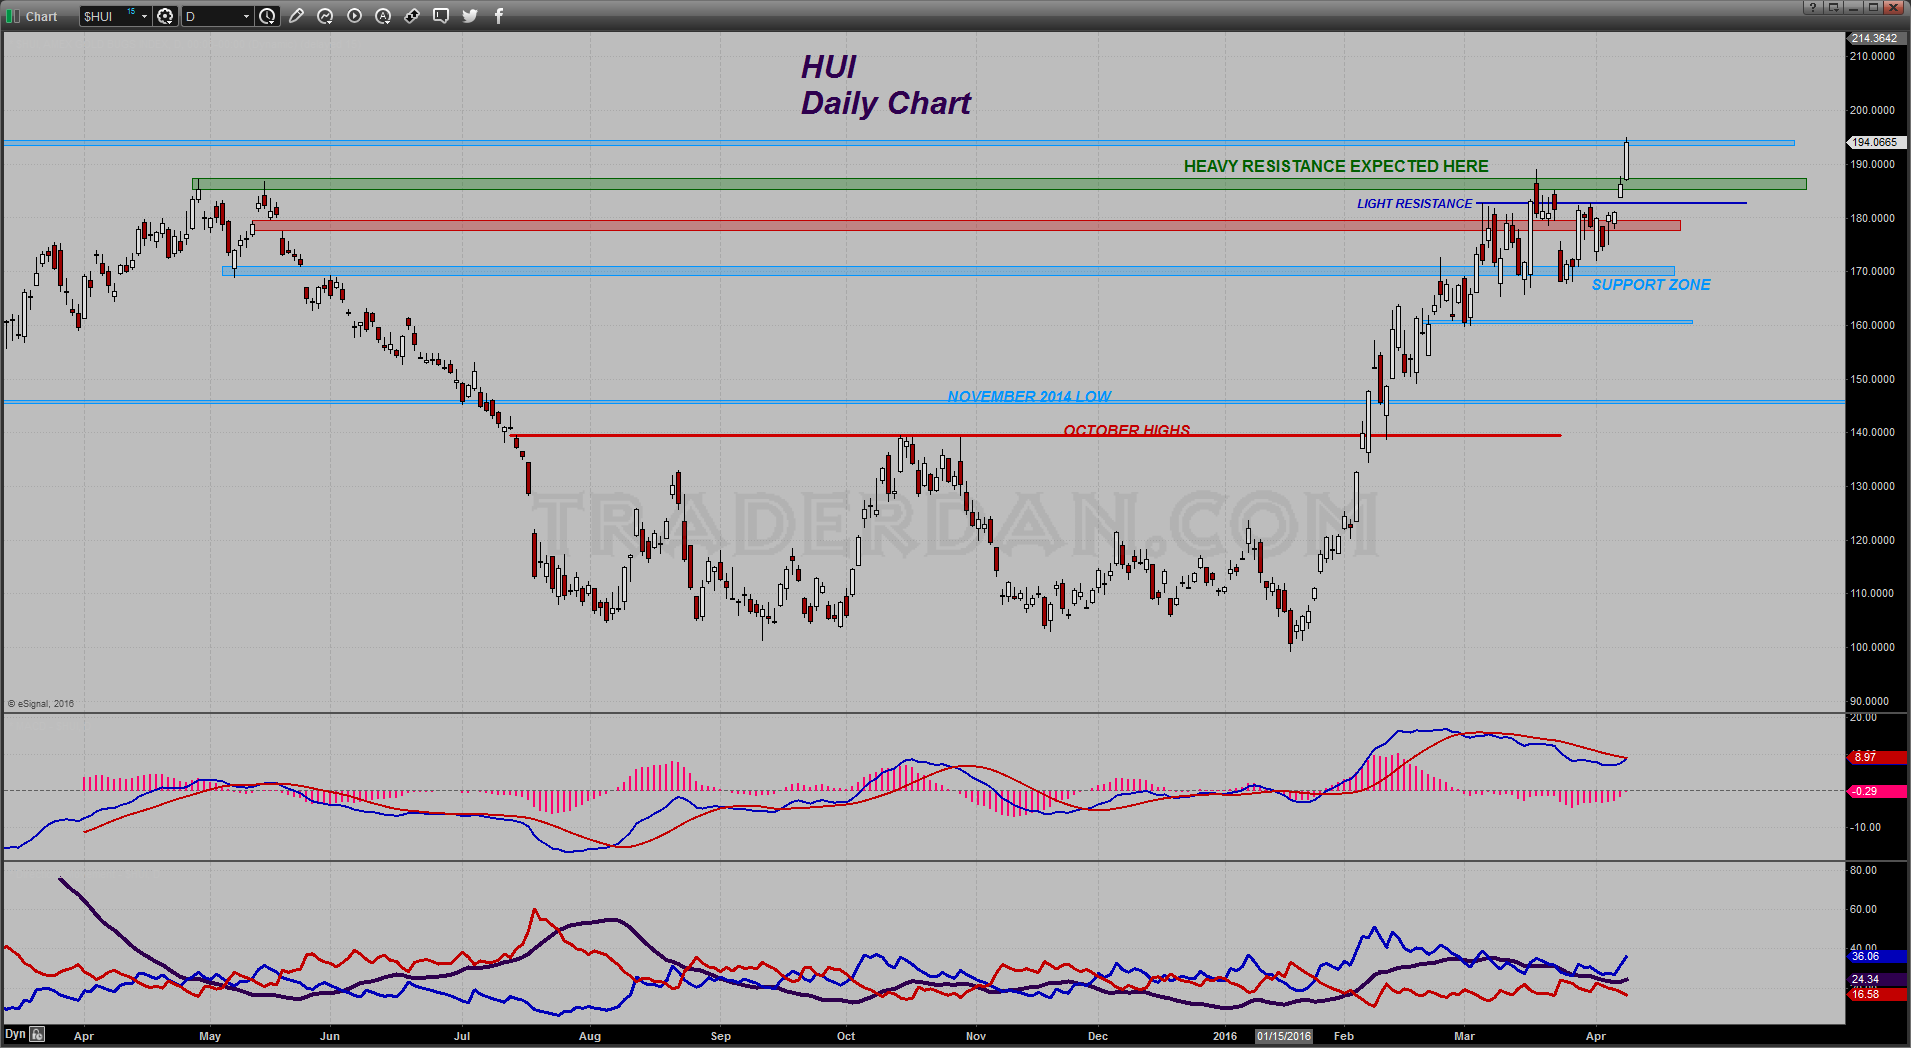
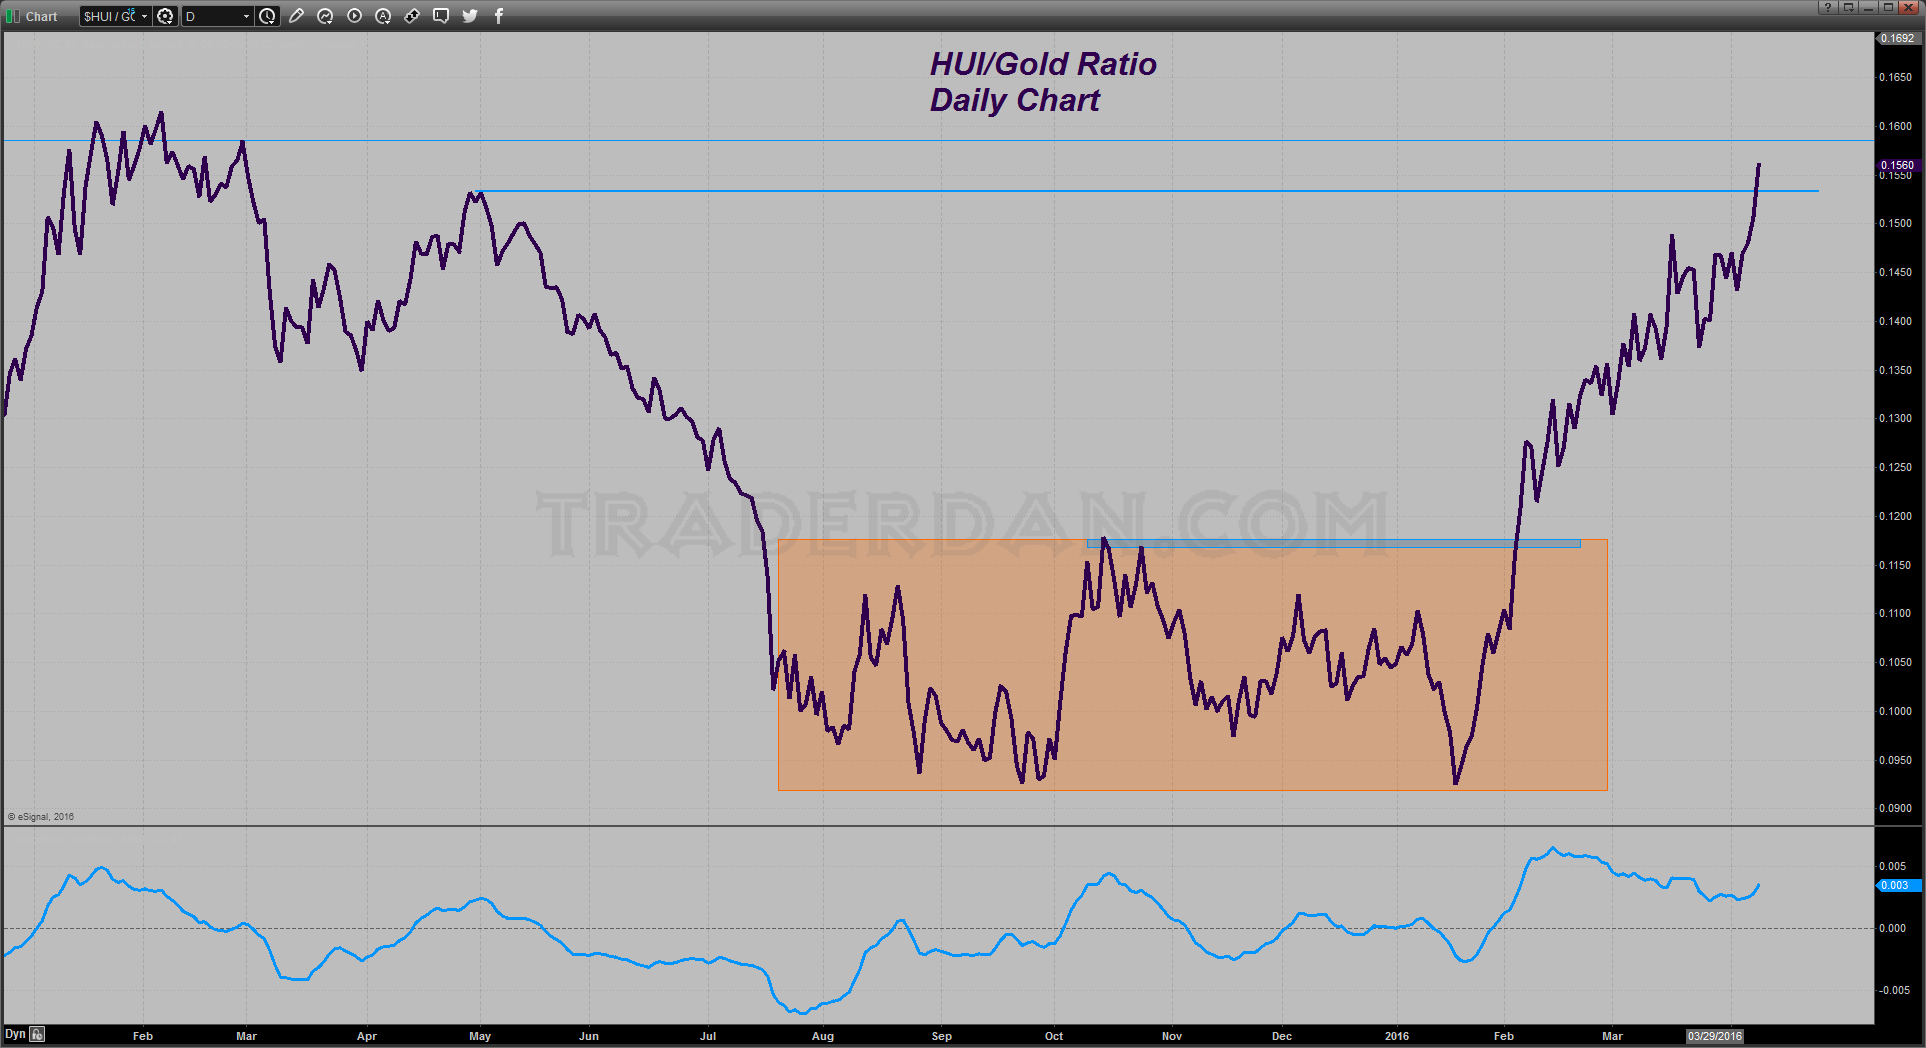
Near term, the gold mining stocks as represented by the HUI are suggesting that the upside is more probable than downside at the moment.
The reason I say this is not only on account of the strong performance by the miners recently, but the HUI/Gold ratio is surging.
This ratio has a history of being rather reliable as a LEADING INDICATOR of the gold price direction.
The slight reduction in SPDR Gold Shares' (NYSE:GLD) reported holdings is noteworthy but withdrawals/reductions thus far remain muted while the technicals such as the HUI’s strong showing and rising ratio would seem to be outweighing those reductions in my mind for the time being.
Ever since Yellen and company decided to sacrifice the US dollar in order to prop up the Emerging Markets, gold has refused to back down. Barring some sort of yet another shift again in their attitude towards the dollar, it would seem unlikely for a sharp breakdown in the gold price in spite of that imbalanced spec long position.
Simply put, while the specs are overextended on the long side, from a fundamental perspective, there just does not seem to be enough of a catalyst to spook them enough to send them heading for the hills in a large way at this time. As long as the downside support levels continue to hold firm, they will stick around.

