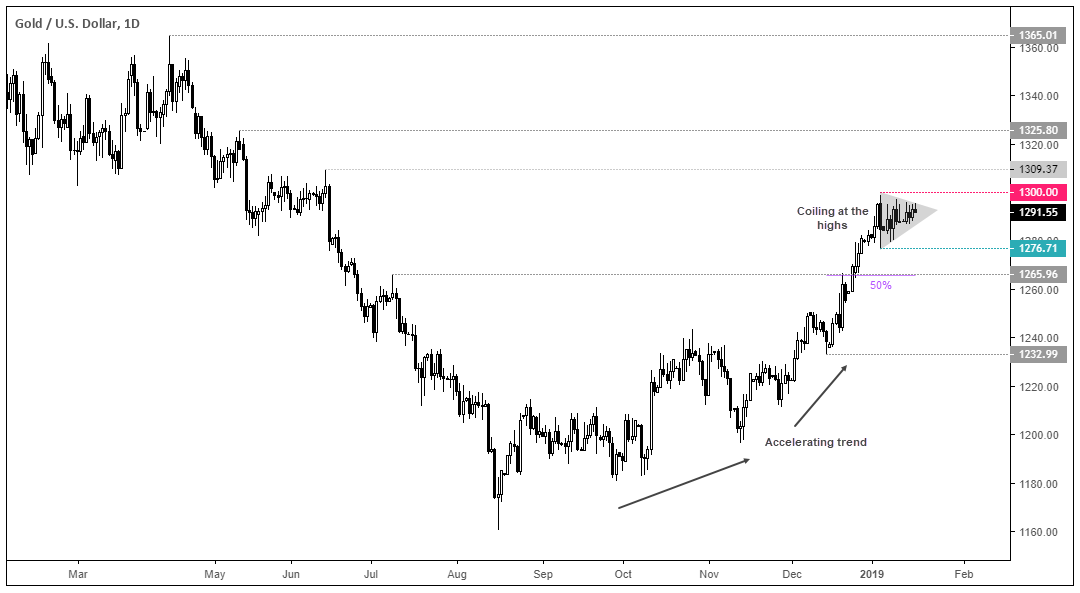
With gold coiling at its highs amid an accelerating trend, we’re looking for a break of 1300.

We can see on the daily chart that the structure is firmly bullish and its trend is accelerating to show an increase of underlying momentum. Moreover, prices are coiling below 1300 to suggests a burst of volatility could be near. With an increasingly strong bullish trend, the bias for a break above 1300 to target the 1309.37 and 1325.80 highs. However, if bearish momentum is to return below 1300, the 1276.71 makes a suitable counter-trend target. Even if it were to retest the 1265.96 high / 50% retracement level, the trend would remain technically bullish. Only a break below 1232.99 invalidates the current trend structure. Therefore, we’d expect any downside to be corrective at this stage and for bulls to have another crack at 1300.

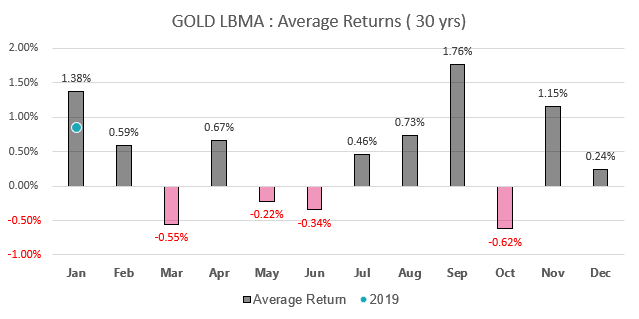
It’s also worth noting that seasonality appears favourable for further gains over the coming weeks. Over the past 30 years, January has averaged a +1.38% gain to make it the second strongest month of the year, behind September. Currently up around 0.85% this month, it’s following its seasonal tendency and leaves potential for further upside as we head towards the end of the month. Furthermore, January has been positive 54.9% of the time over the past 30 years to show the seasonal tendency has a higher probability than a flip of a coin.

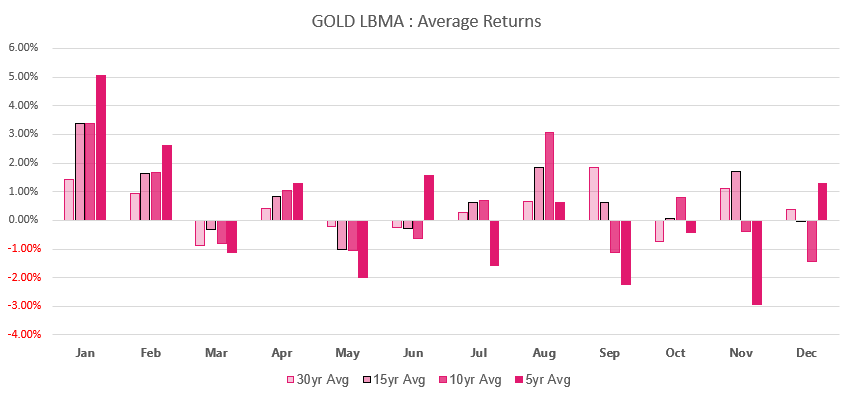
That said, the picture changes slightly if we compare different time horizons. Looking at the 30, 15, 10 and 5-year averages shows that January and February have been the strongest months over the past 5 and 10-years (with January also the strongest month over the past 15-years). Combined with its 54.9% ‘success rate’ for bulls, January looks like a solid month for bulls overall. So, with 6-weeks until the end of February and a bullish structure on the daily charts, we’re keen to explore bullish setups.
