For gold bugs, and even for their lesser brethren in silver, not only is the sun shining in the summer months, but the sun is truly shining on gold as a confluence of factors helps to propel the precious metal ever higher. One wonders when the angst-laden doom mongers will appear, forecasting an overbought position.
The good news for gold bugs: not just yet. With tensions rising once again in the Korean peninsula, the rush to safe havens may yet accelerate further. All this of course is also against the backdrop of endemic US dollar weakness as the markets continue to hammer the currency of first reserve, ignoring the rhetoric from Yellen and the Fed.
We are also seeing an increasing lack of confidence in the Fed as board members come forward with divergent views, driven by the softening of economic data. What is perhaps most interesting from the overnight rise in risk-off appetite, this has failed to see any flows into the US dollar as a result, generally the primary paper-based safe haven currency.
It was also interesting to note yesterday’s 5-year T-note auction did see yields fall from 1.884% to 1.742% but with the bid to cover flat at 2.58.
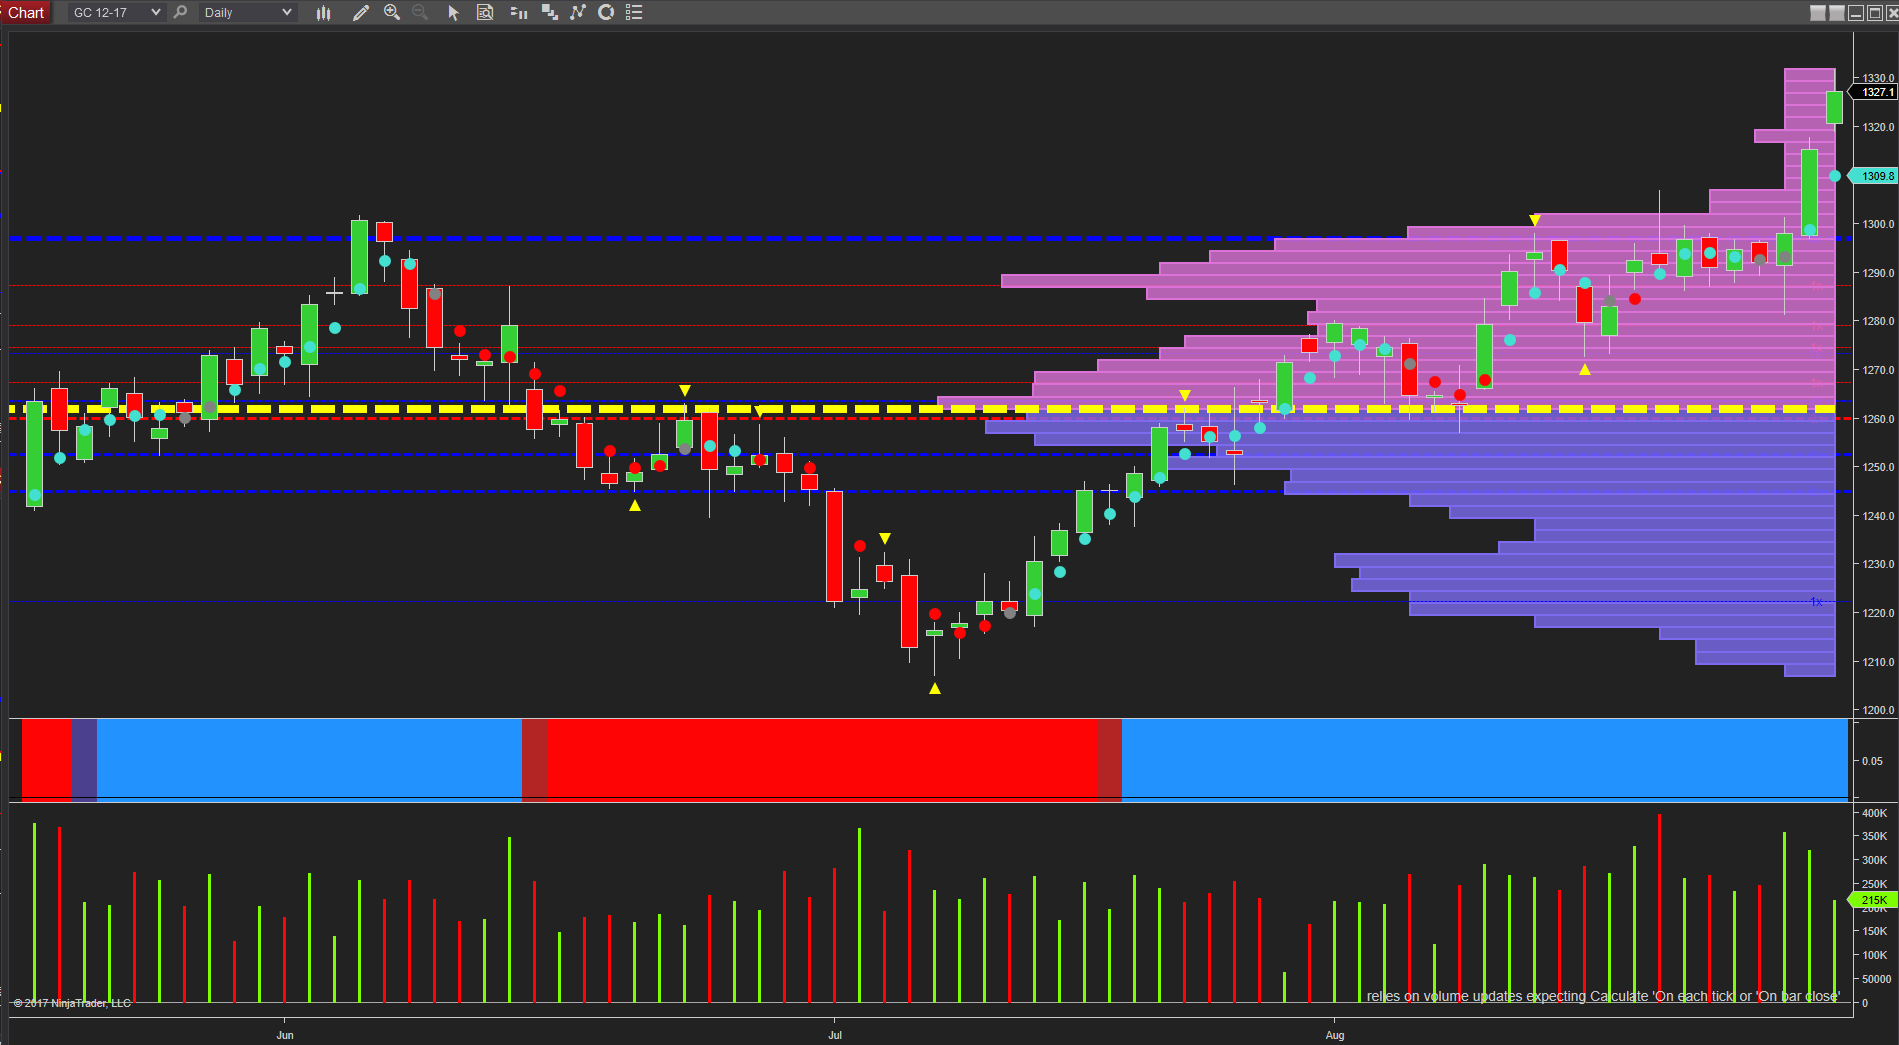
For gold on the daily chart, the trigger for the next leg higher was yesterday’s price action which propelled the precious metal up through the psychological $1300 per ounce area on solid and supportive volume. Indeed the previous day there was also a clear signal of buying volume, with the deep wick and positive close on the session.
This morning has seen gold continue to climb higher, driven by risk. The commodity is currently trading at 1327.40 per ounce, but off the highs of the session at $1331.90 per ounce.
The volume point of control remains firmly anchored in the $1265 per ounce area. With little in the way of volume resistance ahead on the daily chart and solid support in place below, the outlook for gold continues to remain firmly bullish.

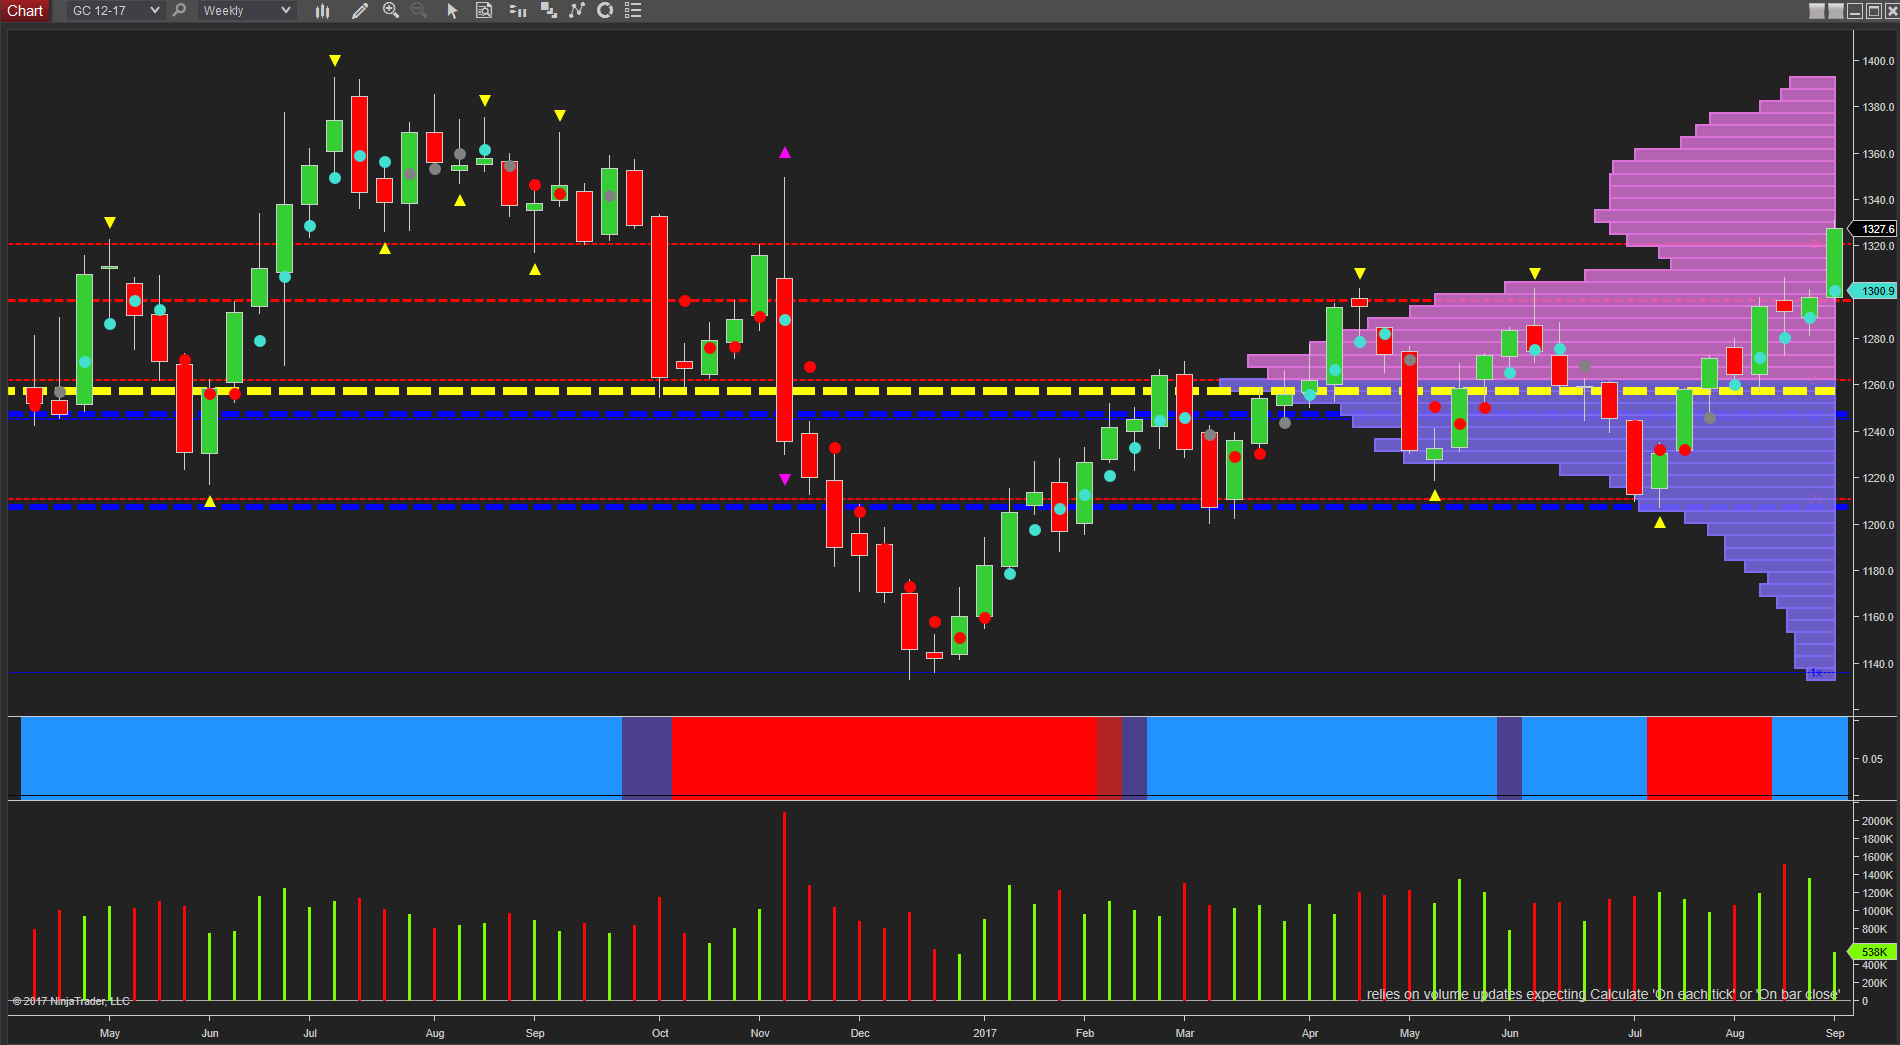
Moving to the weekly chart, this then provides us with some context as to any longer-term move and potential areas where gold might struggle, with the $1340 to $1380 per ounce area, heavily congested from 2016. For the metal to continue higher, this area will need to be breached with sustained and rising volume, but may well provide some stiff resistance in the longer term, with high volume nodes now waiting ahead in the $1340 to $1360 per ounce region.
So we may expect to see a consolidation phase build in this region in due course, but should tensions escalate further, this area could be taken out on safe haven flows with a move towards $1400 per ounce longer term.
