NVDA Q3 Earnings Alert: Why our AI stock picker is still holding Nvidia stockRead More

Gold And USD/ZAR Analysis – 28.02.18

Published 02/28/2018, 09:30 AM
Updated 03/21/2024, 07:45 AM
USD/ZAR
-
XAU/USD
-
GC
-

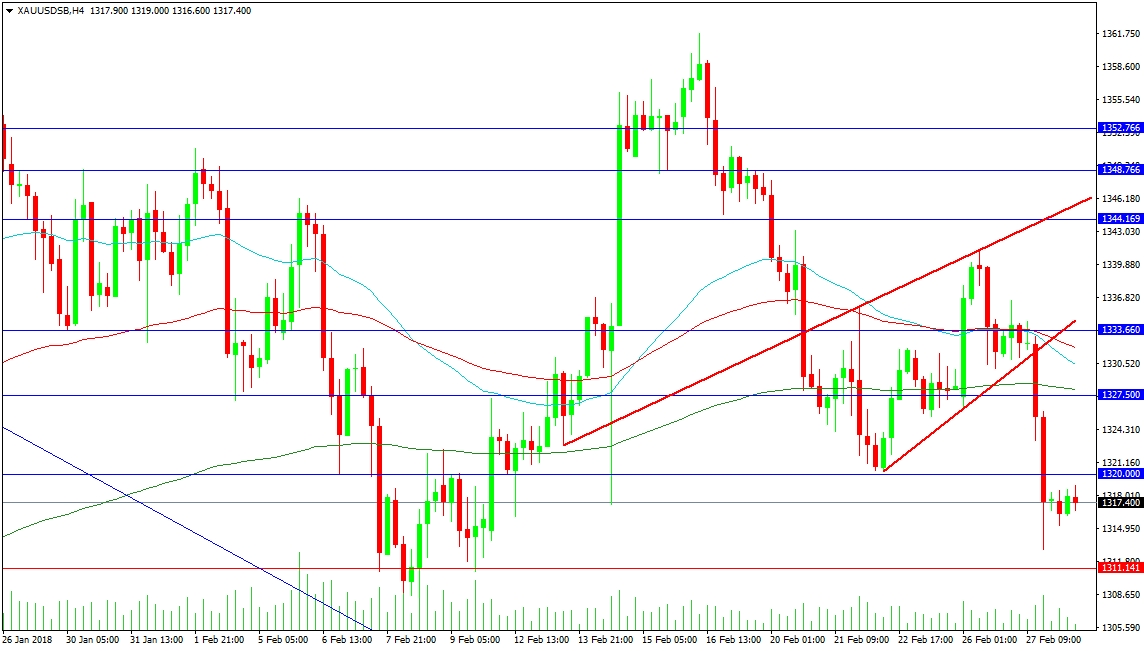
Gold dropped back lower yesterday, with a loss of the 1330.00 area. It is currently trading around 1317.00, with yesterday’s low at 1312.90. Further support comes at 1311.14 and the 13000.00 level. Below is 1289.50 and 1276.40. The chart shows that, so far, a higher low has been created above the support levels reached in early February. While price stays above that low, gold bulls remain in control. Comments from Chairman Powell yesterday seem to have led to the current decline.

Resistance can be found at 1327.50, with the 200-period MA close above. The 50 and 100-period MAs are located around 1331.00 today, with the 50 MA being used as resistance before the last leg lower. A recovery above 1333.60 targets 1344.00 and the red top of the wedge at 1347.00. The resistance levels above this area come in at 1348.76 and 1352.76, followed by the February high at 1361.80. The 2018 high set in January is found at 1365.30.

XAU/USD H4 Chart

USD/ZAR

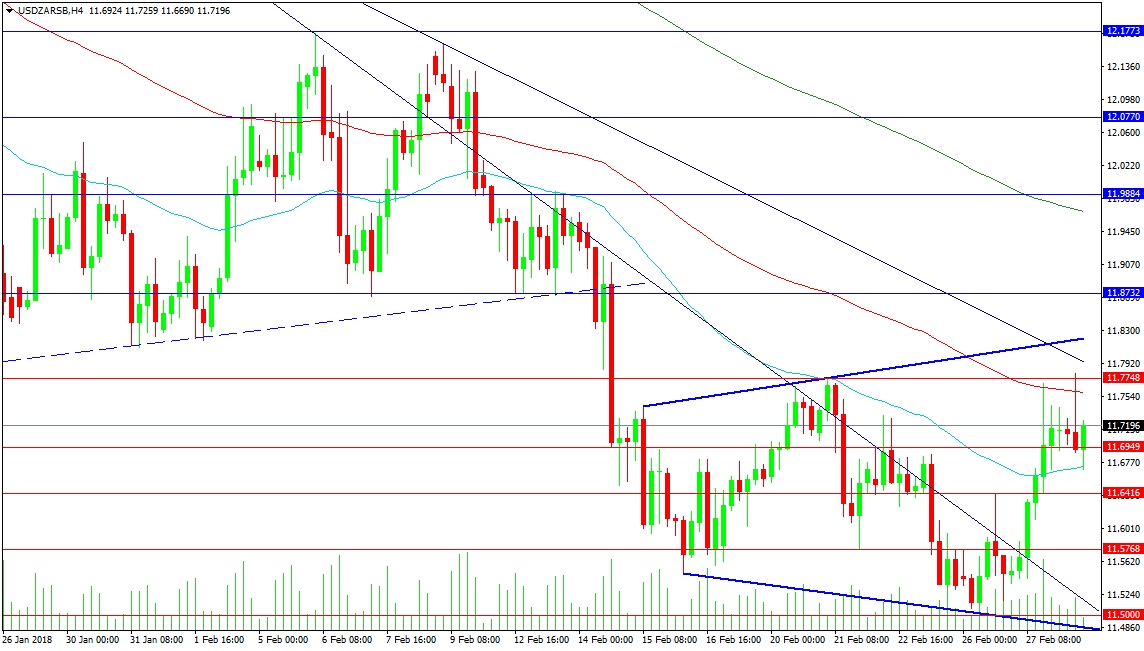
The USD/ZAR pair has formed a Broadening pattern. Sometimes, this pattern can signal a bottom, so it is worth watching for a move higher through the trend line at 11.8193. At present, the price is being held down by resistance at 11.7748, with the 100-period moving average at 11.7586 and a falling trend line at 11.7950. Further resistance is found at 11.8732 and 11.9000. The falling 200-period MA is at 11.9679, close to the 11.9884 level. The February high is found at 12.1773, with the 12.0000 and the 12.0770 obstacles on the way up.

Support has been eroded at the 11.6949 level but the 50-period MA, at 11.6721, has proved enough to arrest the last retracement lower. Below is the 11.6416 level, followed by 11.5768. The 11.5000 level has a trend line falling to support it, with the pattern bottom just below at 11.4865.

USD/ZAR 4-Hour Chart

Latest comments

Loading next article…
Risk Disclosure: Trading in financial instruments and/or cryptocurrencies involves high risks including the risk of losing some, or all, of your investment amount, and may not be suitable for all investors. Prices of cryptocurrencies are extremely volatile and may be affected by external factors such as financial, regulatory or political events. Trading on margin increases the financial risks.
Before deciding to trade in financial instrument or cryptocurrencies you should be fully informed of the risks and costs associated with trading the financial markets, carefully consider your investment objectives, level of experience, and risk appetite, and seek professional advice where needed.
Fusion Media would like to remind you that the data contained in this website is not necessarily real-time nor accurate. The data and prices on the website are not necessarily provided by any market or exchange, but may be provided by market makers, and so prices may not be accurate and may differ from the actual price at any given market, meaning prices are indicative and not appropriate for trading purposes. Fusion Media and any provider of the data contained in this website will not accept liability for any loss or damage as a result of your trading, or your reliance on the information contained within this website.
It is prohibited to use, store, reproduce, display, modify, transmit or distribute the data contained in this website without the explicit prior written permission of Fusion Media and/or the data provider. All intellectual property rights are reserved by the providers and/or the exchange providing the data contained in this website.
Fusion Media may be compensated by the advertisers that appear on the website, based on your interaction with the advertisements or advertisers.
© 2007-2024 - Fusion Media Limited. All Rights Reserved.