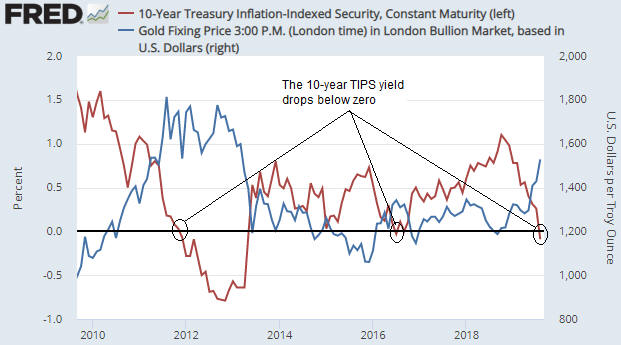
It’s well known that the USD gold price often trends in the opposite direction to the U.S. real interest rate. This relationship is illustrated by the following chart in which the real interest rate is represented by the yield on the 10-year TIPS (Treasury Inflation Protected Security).
Notice that the 10-year TIPS yield has just gone negative and that the previous two times that this proxy for the real interest rate went negative the gold price was at an important peak. Specifically, the real interest rate going negative in August 2011 coincided with a long-term top in the gold price and the real interest rate going negative in July 2016 coincided with an intermediate-term top in the gold price.
If gold tends to benefit from a lower real interest rate, why would the gold price reverse downward shortly after the real interest rate turned negative?

Considering only the 2016 case, the answer to the above question seems obvious, because in July 2016 the TIPS yield reversed course and began trending upward soon after it dipped into negative territory. In other words, the downward reversal in the gold price coincided with an upward reversal in the real interest rate. However, in 2011-2012 the real interest rate continued to trend downward for more than a year after the gold price peaked.
We think there are two reasons why the gold price didn’t make additional gains in 2011-2012 after the real interest rate turned negative. First and foremost, the real interest rate is just one of several fundamental gold-price drivers (the 10-year TIPS yield is one of seven inputs to our Gold True Fundamentals Model), and after August-2011 the upward pressure exerted by a falling real interest rate was counteracted by the downward pressure exerted by other fundamental influences. Second, in August-2011 a further significant decline in the real interest rate had been factored into the current gold price.
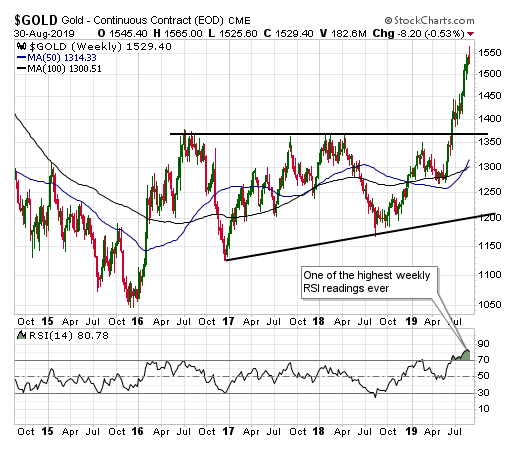
The risk at the moment is that on a short-term basis the bullish fundamental backdrop, including the potential for a further decline in the ‘real interest rate,’ is fully discounted by the current price. This risk is highlighted by the fact that the total speculative net-long position in Comex gold futures is very close to an all-time high. It is also highlighted by the fact that the RSI displayed in the bottom section of the following weekly chart is almost as high as it ever gets.

