There is a decline in the number of reads in our articles that do not provide a fully developed "fundamental" story about why gold and silver should be much higher in price, [but are not]. Relying upon charts to more accurately capture the developing "story" does not capture the imagination of as many readers, for whatever reason. We attribute this to Confirmation Bias where a reader wants to read an article that confirms his/her beliefs The accuracy/validity/truth may or may not be true, but is satisfies an emotional need for affirmation.
The true story of gold and silver is a simple one. There is a recognized and acknowledged shortage of supply in opposition to the greatest demand for both precious metals, for at least in recent memory, if not all time. Current prices are in total disregard to the fixed law of Supply v Demand, or perhaps more accurately stated, in total defiance of that law. It is the most reliable of truths that when demand is in far excess of supply, price goes higher.
This has not been the case for precious metals for the past two years, as central banks have been actively suppressing prices in order to preserve their fiat currencies, particularly the Federal Reserve's "dollar." In our last article, Cognitive Disconnect Between Physical an Paper, we covered several aspects that addressed political/central banker motives that account for why gold and silver are not rising in value.
It is all about money, following the money, for money is power, and those central bankers currently in power face losing it. Desperate people do desperate things, and the power hungry will destroy all currencies to keep themselves where they are. Even they know the clock is ticking. Repeating statistics, dwindling exchange supplies, etc, etc, etc, has done nothing to otherwise explain why PM prices remain low.
Fundamentals are relative, charts are absolute. They accurately reflect all that is going on, regardless of reasoning/motivation. A few, or some, the number[s] do not matter, have no regard for the validity of PM charts which reflect a bogus paper market. To an extent, the paper markets are bogus, but the number of contracts being sold are large, much larger than buyers, and this ironically reflects the reality of supply v demand.
As to the physical, China being the largest buyer for whatever is available, there is no reason for China and the other buyers to want price to go to higher levels when they can be buying so cheaply. The suppressed prices may even be an accommodation to China and others to compensate for the depreciating/disappearing "value" of toxic bonds the US has been dumping on the world for so long. That game is over, but no one has a fix on the time line for ending the fiat currency Ponzi scheme and reverting back to some kind of gold-back currency sponsored by China and the other BRICS nations.
Right now, the charts are letting us know that higher PM prices are unlikely to occur anytime soon. Barring some kind of "overnight surprise" that will shock the markets, odds favor lower prices over higher prices unless and until demand shows up in chart activity.
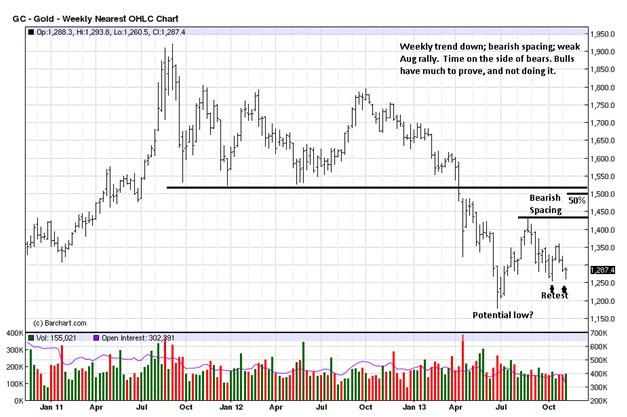
Whenever a trend is down, the onus is on buyers to create a change. Right now, that is not happening. We show the bearish spacing, a sure sign of weakness and one of sellers being in control. The 50% retracement level is also shown, and the August swing rally failed to reach that level. A half-way retracement is a general guide used to measure the relative strength/weakness of a trend. In a down market, when a retracement rally cannot retrace to the half-way level, it is a sign of greater market weakness.
There is a small possibility of a low from the last week of June, and there have been two potential retests that have held, so far. If this lower probability proves out, it is unfolding in a weak manner, which is no surprise given what was just explained about the character of the market's overall weakness.
Assume for the moment that we are looking at a possible low, because it is developing slowly, even under this scenario, it will take much more time for buyers to turn this market around. Should price go lower still, then the time frame for a turnaround will be extended even more.
This is a weekly chart, and it take more time and effort to make a turn in trend.
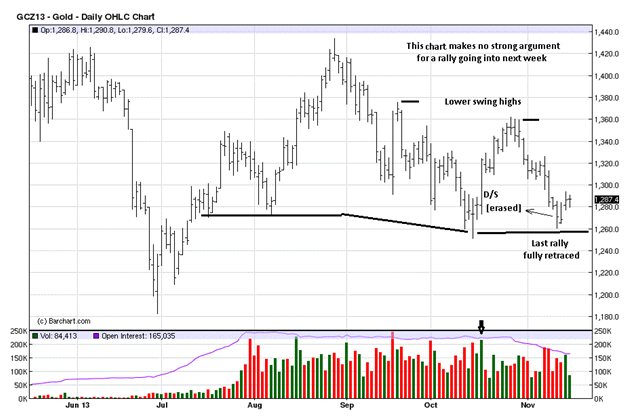
The fact about the daily gold chart is that it continues to make lower highs, and that is a characteristic is a down trending market, so the message here remains clear. There was a high volume strong rally in mid-October. The bar is marked "D/S," Demand over Supply. This positive expression of demand was erased by the 4th bar from the right. Another fact is that the October rally effort was totally retraced, last week. Both are signs indicating the weak character of the gold market. 
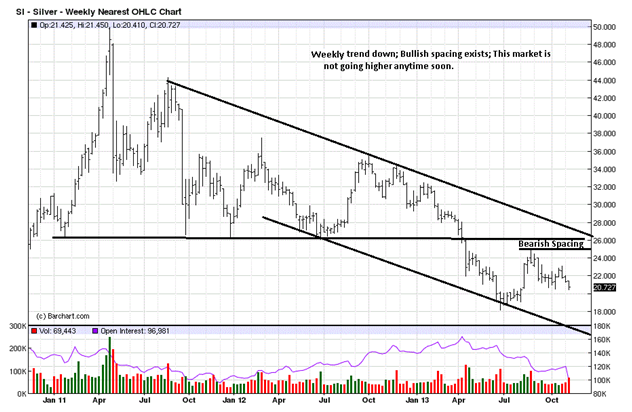
Silver is not faring any better. Regardless of whatever positive fundamental consideration one can advance, the chart structure is telling us silver is struggling. We see evidence of that from the bearish spacing, supportive of overall weakness.
Also, note the location of the last two little swing high rallies. The last one, 3rd bar from the right, is a lower swing low, a sign right there, but both fall short of rallying half-way in the down channel, once again, echoing weakness.
As with gold, the June low has the potential of being a bottom, but it needs more confirmation than we are seeing, to date.
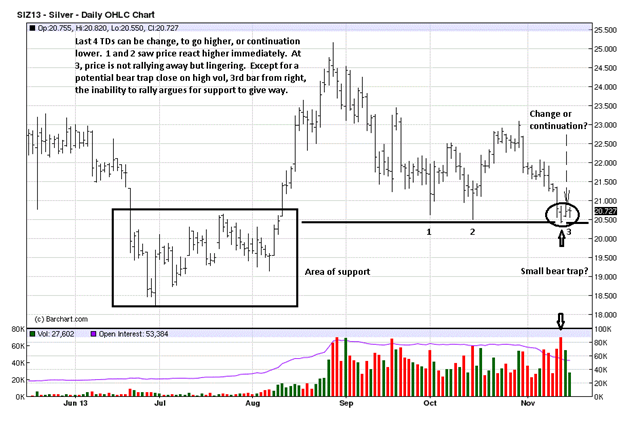
The arrow pointing to the sharp increase in volume, and the poor close on the bar, at a support area, resulted in a price gap up from the close, next day. It could be a small bear trap. Friday's close was upper end on the bar, and that says buyers won over sellers for that day. The only caveat we hold is how price has been unable to rally from support right away, as it did at points 1 and 2. Weak rallies lead to lower prices, so buyers better step up on Monday, or silver can break current support.
The best feature about buying physical gold and silver is that charts do not matter. Just keep on buying, especially at these lower prices. These low levels may last for some time, but timing is less of an issue for accumulating tangible assets that cannot be debased and have no counterparty risk. Beat the central bankers at their own game.
- English (UK)
- English (India)
- English (Canada)
- English (Australia)
- English (South Africa)
- English (Philippines)
- English (Nigeria)
- Deutsch
- Español (España)
- Español (México)
- Français
- Italiano
- Nederlands
- Português (Portugal)
- Polski
- Português (Brasil)
- Русский
- Türkçe
- العربية
- Ελληνικά
- Svenska
- Suomi
- עברית
- 日本語
- 한국어
- 简体中文
- 繁體中文
- Bahasa Indonesia
- Bahasa Melayu
- ไทย
- Tiếng Việt
- हिंदी
Gold And Silver: When Fundamentals Fail And Charts Prevail
Published 11/16/2013, 06:42 AM
Updated 07/09/2023, 06:31 AM
Gold And Silver: When Fundamentals Fail And Charts Prevail
Latest comments
Loading next article…
Install Our App
Risk Disclosure: Trading in financial instruments and/or cryptocurrencies involves high risks including the risk of losing some, or all, of your investment amount, and may not be suitable for all investors. Prices of cryptocurrencies are extremely volatile and may be affected by external factors such as financial, regulatory or political events. Trading on margin increases the financial risks.
Before deciding to trade in financial instrument or cryptocurrencies you should be fully informed of the risks and costs associated with trading the financial markets, carefully consider your investment objectives, level of experience, and risk appetite, and seek professional advice where needed.
Fusion Media would like to remind you that the data contained in this website is not necessarily real-time nor accurate. The data and prices on the website are not necessarily provided by any market or exchange, but may be provided by market makers, and so prices may not be accurate and may differ from the actual price at any given market, meaning prices are indicative and not appropriate for trading purposes. Fusion Media and any provider of the data contained in this website will not accept liability for any loss or damage as a result of your trading, or your reliance on the information contained within this website.
It is prohibited to use, store, reproduce, display, modify, transmit or distribute the data contained in this website without the explicit prior written permission of Fusion Media and/or the data provider. All intellectual property rights are reserved by the providers and/or the exchange providing the data contained in this website.
Fusion Media may be compensated by the advertisers that appear on the website, based on your interaction with the advertisements or advertisers.
© 2007-2025 - Fusion Media Limited. All Rights Reserved.