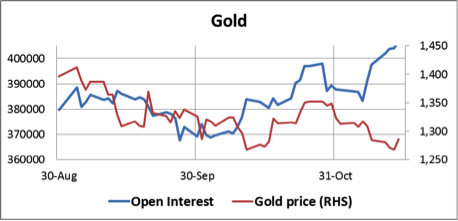
Gold started on Monday with a continuation of last Friday's fall, bottoming out on Tuesday at $1261 in US trading. From then on the price rallied to close $25 higher at $1287 on Thursday.
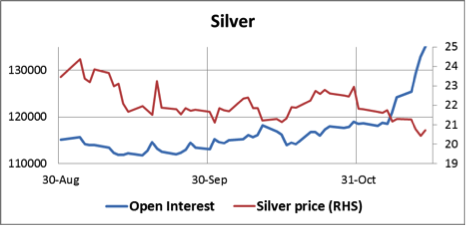
Sentiment for gold and silver in Western capital markets is now extremely bearish, and this has been reflected in an increase in open interest on Comex as prices fell, illustrated in the charts below.

It is unusual to see open interest increase substantially on falling prices. In gold, it represents additional short sales amounting to 72.4 tonnes since 6th November, and in silver nearly 2,600 tonnes. So far it has failed to drive the gold price below $1200, but if last week was anything to go by then a bear-raid later today cannot be ruled out, when Far Eastern buyers are absent from the market. However, if the recent low at $1261holds this action will be judged with hindsight as a selling climax, which is ultimately bullish.
The other side of the gold trade for many dealers is the dollar and US Treasury yields, both of which have been rising recently. These rises began to reverse ahead of Janet Yellen's confirmation hearing at the Senate yesterday. We learned from that there will be little change in Fed monetary policy, and importantly, Ms Yellen confirmed to us she sees no bubbles in stocks and property. She also evaded attempts to get her to commit to tapering or admit that the Fed was boxed into a corner.
This week the World Gold Council released its estimates of gold demand for Q3 2013. Their figures for Greater China (including Hong Kong and Taiwan) show this to have been 220.1 tonnes, which compares with physical deliveries of 573.4 tonnes on the Shanghai Gold Exchange alone. The disparity between the WGC version and other hard statistics was questioned by Eric Sprott in an open letter to the WGC recently. In the WGC's reply they cited differences due to stocking/destocking and round-tripping (presumably arbitrage), but the gap between Sprott's figures based on import/export statistics and theirs appears to be too great to be explained in this way.
Furthermore, earlier data releases by the WGC claimed Chinese demand peaked at 306.4 tonnes in Q1, falling to 294.6 tonnes for Q2. This cannot be the case, because the acceleration in demand occurred in Q2 after the April price smash. This is confirmed by physical deliveries through the Shanghai Gold Exchange which totalled 641 tonnes for Q2, against 458 tonnes for Q1.
