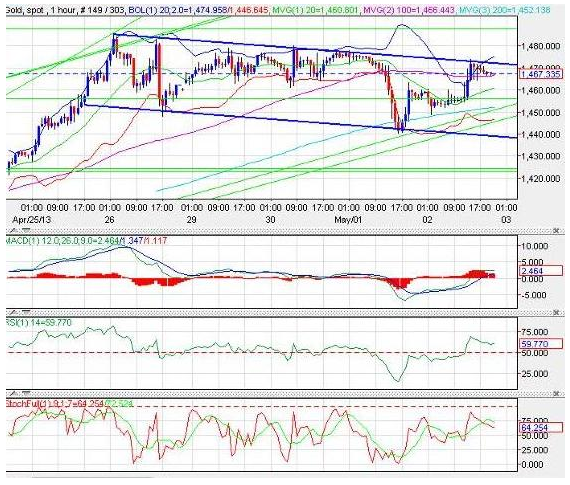
Trading ended with gold heading a lot higher after it found support at Wednesday's low of $1440. The ECB cut interest rate as expected gave gold prices a boost higher as it was initially trending between $1450 and $1455 area in the early European trading session. A better than expected US Jobless claim initially slowed the rally but soon prices moved higher to retest the upper trend line (see below one-hour chart). At the moment, the upper trend line is the resistance at $1474 and the next big resistance stands at $1485. A break pass $1485 will allow gold to retest $1500 and $1515 area.
We picked out an interesting quote from Kristian Kerr, Senior Currency Strategist of DailyFX.com who shared our view -- If the 1320 area is going to undergo some sort of re-test we would expect it to start from somewhere around 1500. On the other hand, if the metal just blows through 1500 then the importance of last month’s low will increase significantly.
We would like to repeat our advice from our previous commentary that the gold market could see possible slowdown in physical demand which may weaken gold rebound. In addition, continuous outflow of funds from ETF only increase selling pressure. Investors who are still holding will be wary of a possible margin call again.
One of the biggest worry is that gold could start to break lower and short sellers continue to add pressure. A break below $1456 (50% retracement) could easily take gold to a low of $1404. However, a break pass $1404 will give the bears more control and prices could fall to revisit $1325 again.
- Resistance: $1487, $1496, $1525
- Support: $1440, $1425, $1404, $1325
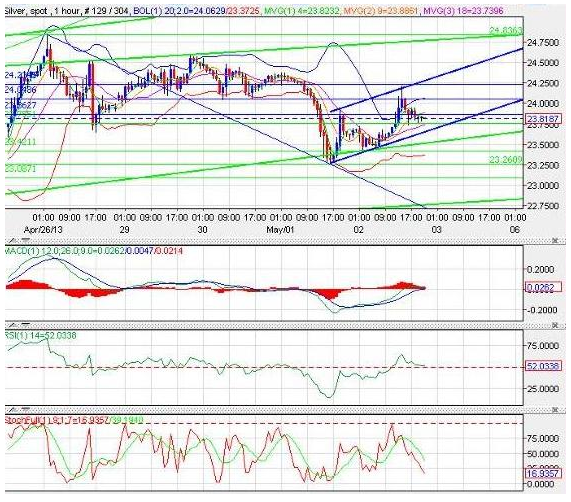
A rebound in gold took silver higher as it also found support at $23.26 (see chart in Gold and Silver -- Warning Signs Ahead!). Technically, the RSI was oversold while the stochastic fast line hit rock bottom. Post-FOMC data has helped spur silver prices higher despite the gloomy economic data. ECB rate cut helped the prices to soar higher with the RSI treading higher which indicate strong buying interest. The MACD has also crossed into the positive territory on the hourly chart and the current trend continues for now.
However, we must continue to warn that the rebound could be on its last leg and a break below the lower trend line (Daily Chart) could spell more downside pressure on the white metal. The market remains bearish and this rebound could prove short lived as the speculators are positioning for more price weakness in the next few weeks.
- Resistance: $24.82, $24.91, $25.59
- Support: $23.26, $22.88, $19.00
