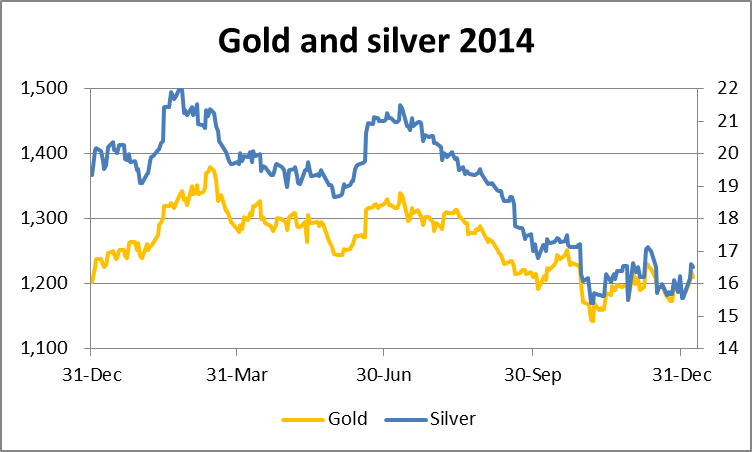
Gold and Silver started the year at a muted point, with gold at $1168 and silver at $15.50, from which modest rallies have developed, with gold up 4% and silver 6%. These rises were against a background of high volatility in equity markets, a strong US Dollar and very weak oil prices.
The firmly entrenched bearish opinions in recent months for the outlook for gold and silver have backed off from recent extremes. There is confusion in dealers' minds, brought about by the threat of deflation and the collapse in oil prices. Whereas hedge funds would automatically sell gold whenever they detected dollar strength, this is no longer the case. Precious metals now seem to be responding more to the threat of global financial instability triggered by a strong dollar, and fund managers are selling other commodities instead. Indeed, it is remarkable that despite the USD hitting new highs against nearly all currencies, gold has not only held its ground but is actually rising.

In reviewing last year, we note that the establishment was bearish of gold with forecasts down to $850. Remember that it was described by one major house as a slam-dunk sell. In the event, gold was more or less unchanged in USD, but rose in nearly all other currencies: 4% in sterling, 11% in euros and 15% in yen. In emerging-market currencies the rise was even greater, for example doubling against the Russian Ruble. Silver, in common with most industrial metals, weakened from mid-year onwards, losing significantly over the year.
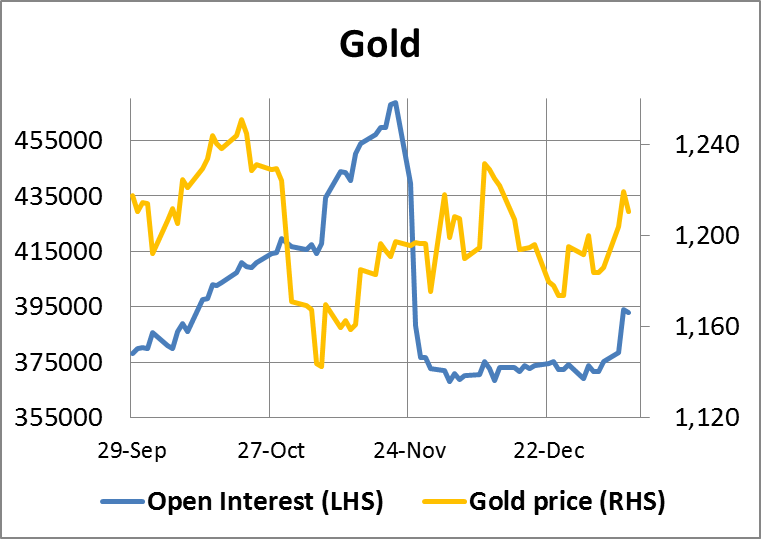
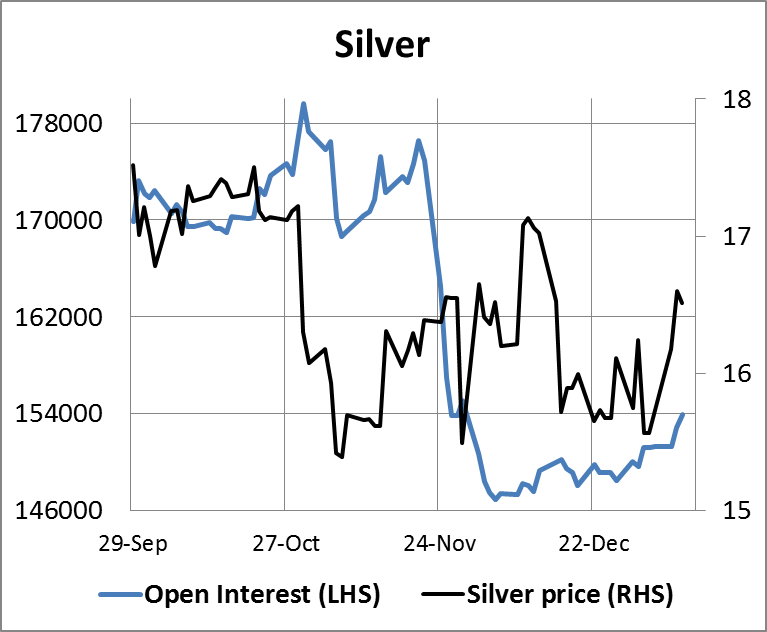
The current market is mildly encouraging for precious metals so far, as the following two charts of Comex open interest illustrate.

Gold's open interest has perked up this week after the sharp fall in November as shown in the chart above, indicating buyers returning to the market. A similar pattern is developing in silver as shown in the next chart.

Over the holidays the gold open forward rate (GOFO) stayed negative, signalling a continuing shortage of physical gold in the market. The pattern of GOFO has been to go more negative on dips below $1200, which suggests that physical buyers have been accumulating bullion at that level.
In the three trading days between Christmas and New Year the Shanghai Gold Exchange delivered a further 28.96 tonnes, giving a total delivered into Chinese wholesale markets for the year of 2,102.36 tonnes, compared with 2,194.99 tonnes in 2013. This is a remarkable figure, and with a revival in Indian demand following relaxation of import restrictions, China and India are officially absorbing the world's mine supply between them, given that there is strong evidence that China's domestic mine output is quietly absorbed by the State.
