Silver still has some way to go before bottoming. It has not rallied despite a lower US Dollar Index (gold and miners did not rally either) and a higher stock market. Silver has bright days ahead, but not until it passes this most recent downward shift in trend. And please remember, gold’s more volatile little brother is more prone to sudden price swings, as traders like to pick up some cheap silver after a pullback.

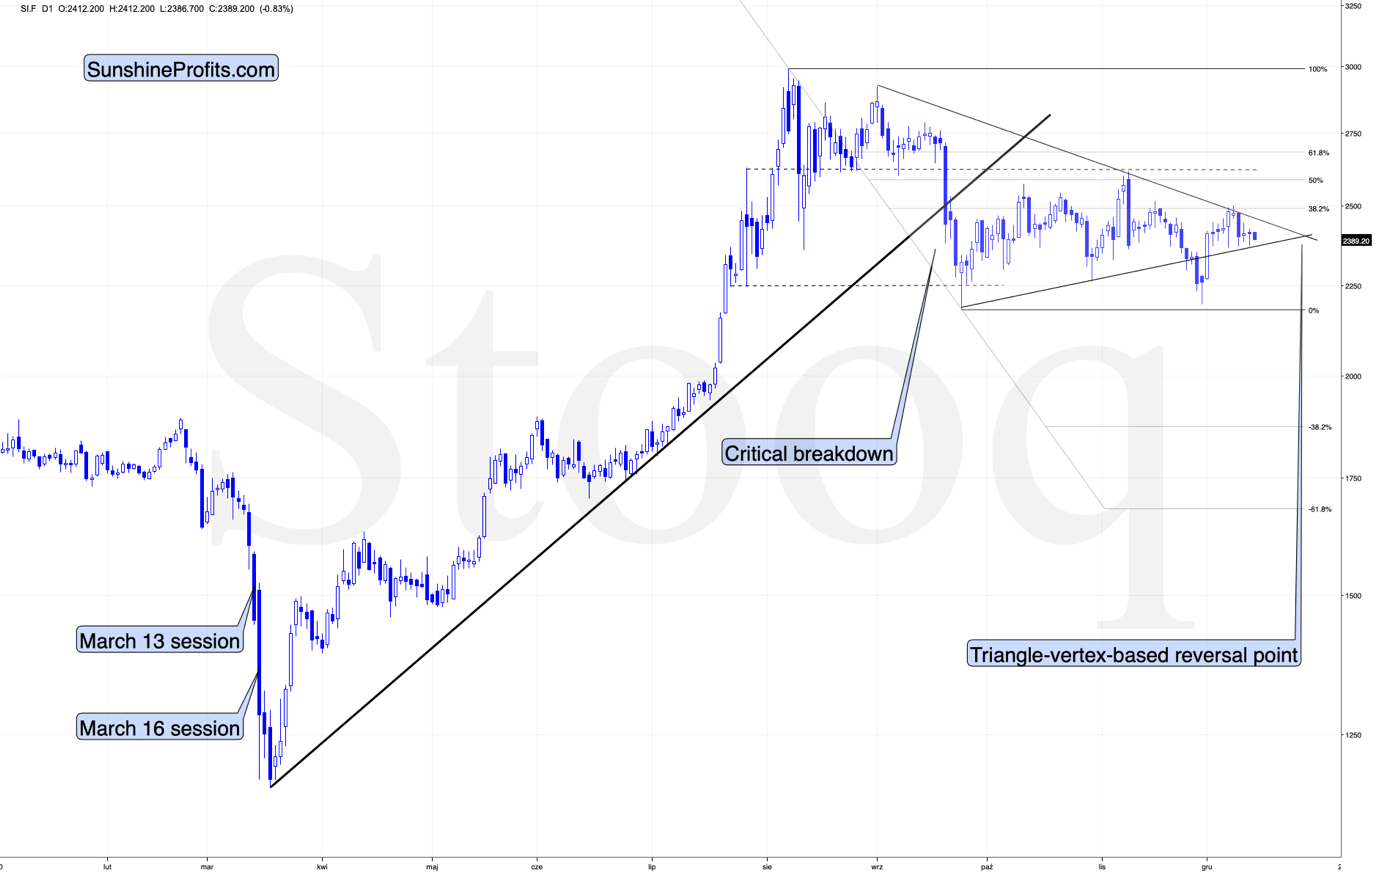
While gold broke below its September low and now verified its breakout, silver just moved to its own September low and then bounced back. After moving higher, silver seems to have topped right at its 38.2% Fibonacci retracement based on the August – September decline and the declining resistance line.
What does this imply? Not much, actually. It means that the white metal is continuing to trade sideways after breaking below the rising, medium-term support line in mid-September.
Silver shrugged off the rally in the general stock market and the decline in the USD Index – it could have rallied on any of the above, and instead it just kept consolidating.
Consequently, silver seems to be preparing for a bigger mover lower.
It’s also important to note that silver is holding up much better than gold and – in particular – mining stocks. If this was the early stage of a rally, miners would have been strong, and silver would have been weak or average. What we see confirms the validity of the bearish case for the next few weeks or months.
Let’s take a look below for details.

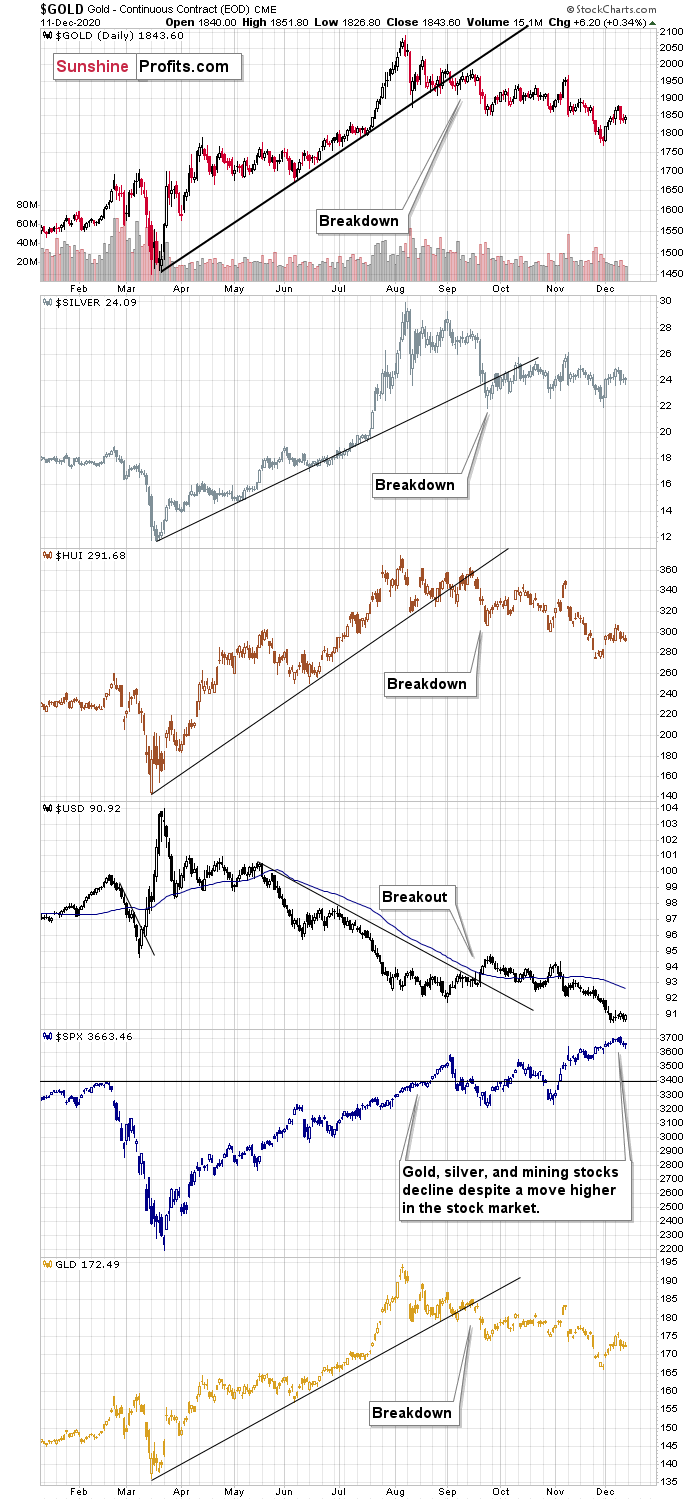
The thing that I want to emphasize today is the aftermath of the clear September moves. It was then that the USD Index broke above its declining resistance line, and it was then that gold and silver broke below their rising support lines. Miners broke below their support line in August, but the final and decisive breakdown took place in September.
What happened since that time? The USD Index moved somewhat higher, but then ultimately moved to and stayed at new yearly lows. Gold, silver and mining stocks should have rallied given the above. They have not.
Silver is more or less at the level just before it broke, gold is below it, and mining stocks are also below it – the most out of the entire trio.
So, it is not only the case that silver was strong and miners were weak in the last several days – it’s been the case over the past few months as well. The implications are bearish.
Moreover, please note that the general stock market moved higher since September, which didn’t trigger a sustainable rally in silver or mining stocks. In fact, the latter just verified their breakdown below their September and October lows. Again, the implications are bearish.
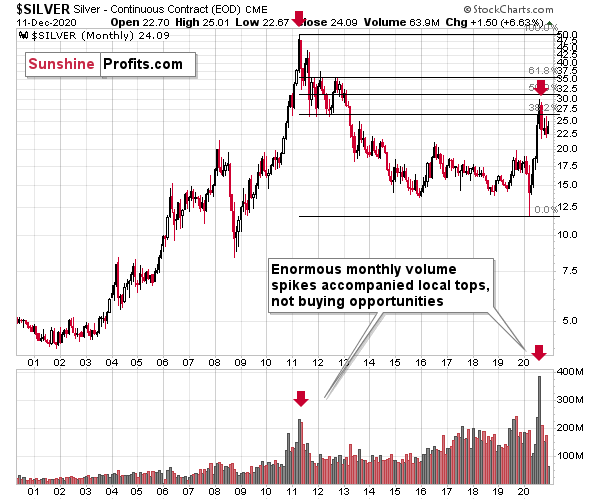
Additionally, the implications coming from silver’s long-term chart are also bearish for the next several weeks (perhaps even months) due to the size of the volume that accompanied the recent monthly rally.

If you look at the monthly silver volume levels, it seems likely that the next sizable downswing has already begun. The previous substantial monthly volume in silver accompanied the 2011 top. The analogy doesn’t get more bearish than this. OK, it would, if there were multiple key tops confirmed by huge monthly volume. But the 2011 top was so significant that other tops are not comparable, except for the most recent one. Thus, the implications are bearish.
Moreover, please keep in mind that while gold moved to new highs, silver – despite its powerful short-term upswing – didn’t manage to correct more than half of its 2011 – 2020 decline.
In fact, silver has already invalidated its move above the lowest of the classic Fibonacci retracement levels (38.2%), which is not something that characterizes extraordinarily strong markets.
Based on the above chart, it seems that silver is likely to move well above its 2011 highs, but it’s unlikely to do it without another sizable downswing first.
