- Gold and Silver vulnerable to further declines as geopolitical risks abate
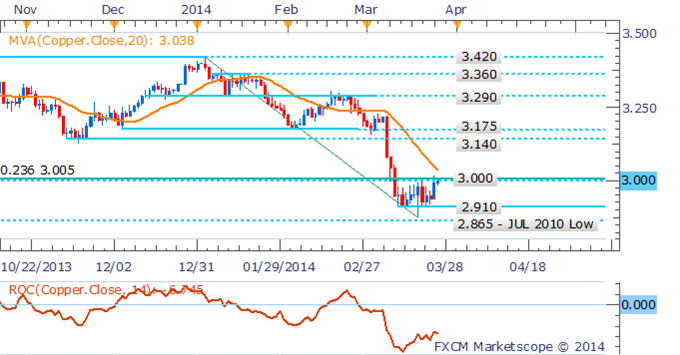
- Copper’s bounces to critical $3.00 level on China stimulus speculation
- $100 handle continues to cap crude Crude Oil gains ahead of inventories data
Gold has been given a reprieve in recent trading as it wavers around the $1,310 level, which follows on from Monday’s dramatic decline of over $26. Meanwhile copper has rebounded back to the key $3.00 handle with newswires attributing the bounce to speculation over fresh stimulus from Chinese policy officials. An upside surprise to US Durable Durable Goods orders data due in the session ahead may bolster demand for growth-sensitive commodities like copper. However, WTI may struggle to break the $100 handle on the back of another weak inventoriesreport.
Gold Bears Letup As Prices Stabilise
There are signs of stabilisation for the precious metals space in Asian trading today as the gold bears pause following a collapse in prices earlier in the week. Easing Ukrainian tensions and hawkish comments from Fed chair Janet Yellen have sapped demand for the fiat-money alternative over the past two weeks as shown in the chart below.
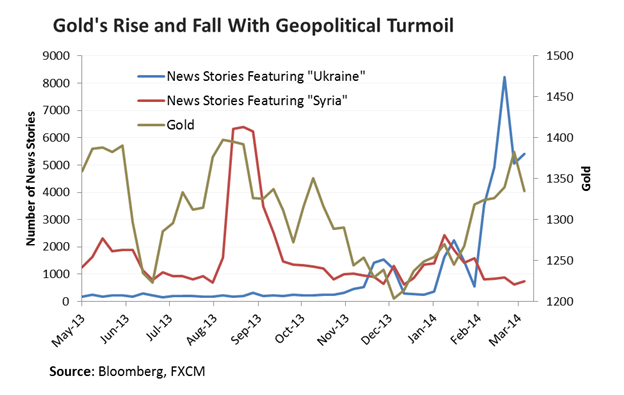
In the absence of a renewed bout of geopolitical turmoil gold may face renewed selling pressure as safe-haven demand for the commodity ebbs further. Additionally, an upside surprise to the US Durable Goods Orders data set to cross the wires in the session ahead may support the US dollar, based on implications for Fed policy, which in turn may weigh on gold and silver.
Copper Stages A Comeback
Growing speculation of new stimulus measures in China have fuelled a bounce in the growth-sensitive commodity with prices hitting the key $3.00 handle in recent trading. Newswires have pointed to recent disappointing economic data from the Asian giant as support for the introduction of fresh stimulus. However, at this stage the reports amount to little more than conjecture and have received little confirmation. This may leave copper vulnerable to a quick correction if investor sentiment sours.
Crude Oil Traders Turn To Inventories Data
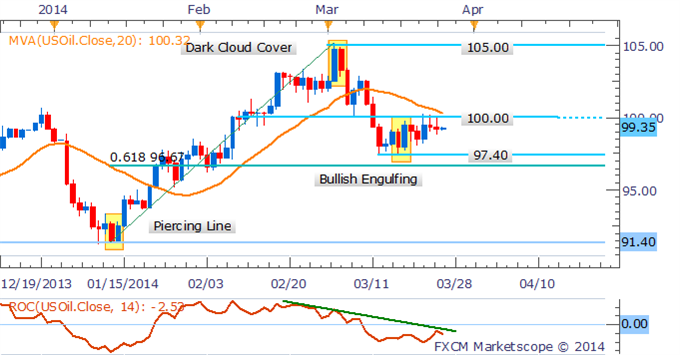
The past week has proven suspenseful for oil traders as the commodity has continued to tease at a break above the psychologically-significant $100 handle. However, the upcoming DOE Weekly Petroleum Status Reportmay prompt renewed selling pressure for WTI, which could offset potential gains on the back of a continued improvement in risk sentiment. Crude inventories are tipped by economists to rise for the 10th consecutive week, which likely reflects an oversupply of the commodity and may be attributable to more moderate weather conditions in the US reducing the need for heating.
CRUDE OIL TECHNICAL ANALYSIS
A bearish technical bias is retained for crude oil as the commodity remains in a short-term downtrend. While a Bullish Engulfing candlestick pattern on the daily has hinted at a bounce, the signal has failed to receive confirmation. A break below support at $97.40 would likely open up the 61.8% Fib Retracement level ($96.70), while the psychologically-significant $100.00 handle continues to offer notable resistance.
GOLD TECHNICAL ANALYSIS
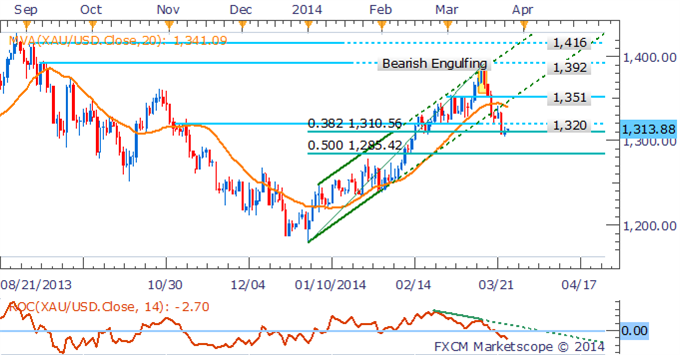
Several bearish technical signals remain for Gold, which may be warning of further declines for the commodity. The short-term trend has shifted to the downside indicated by prices moving below their 20 SMA in addition to a negative Rate of Change reading and a break of the ascending trend channel. This follows on from a warning offered by the Bearish Engulfing candlestick pattern that formed near the key $1,392 resistance level. A break below support at $1,310 (38.2% Fib Retracement Level) would open up $1,285.
SILVER TECHNICAL ANALYSIS
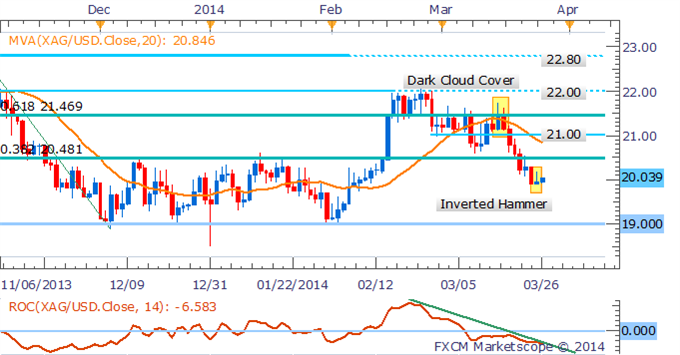
Silver remains in a short-term downtrend as signaled by prices being below their 20 SMA and the rate of change indicator reflecting building downside momentum. While an Inverted Hammer formation may be warning of a short-term bounce, it has yet to receive confirmation from a successive up day. A retracement back towards resistance at $20.50 would be seen as a new opportunity to enter short positions with a target offered by support at $19.00.
COPPER TECHNICAL ANALYSIS
The psychologically-significant $3.00 handle continues to offer noteworthy resistance for copper. A bearish technical bias is retained given the downtrend is still intact which is indicated by prices remaining below their 20 SMA. Fresh declines for copper may be met by buying support at the $2.910 mark.
