The gold and silver stocks have rebounded nicely but have consolidated in recent weeks. Where is this going and how do we know? Well, a few weeks ago we publicly said that a major bottom is in. Thus, we believe the trend will go higher. Beyond belief, we need real confirmation that the sector will continue higher. Enter moving average analysis. By using a few simple moving averages we can better understand the current context and get confirmation that the sector will continue to move higher. GDX, GDXJ and SIL could soon test moving averages which have been resistance for the past 13 months.
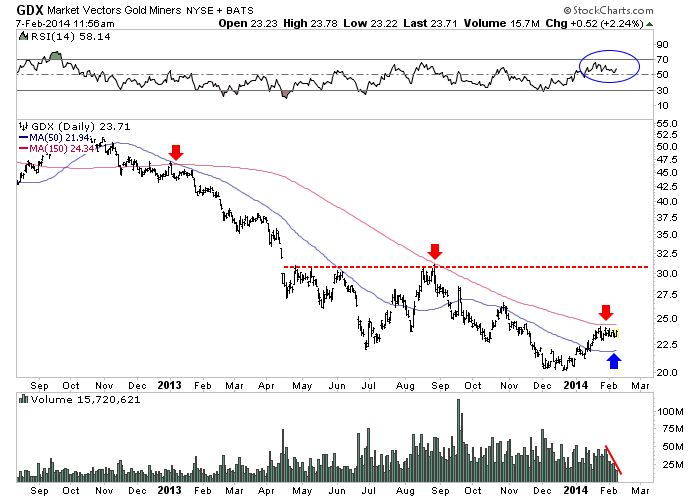
First lets start with GDX. The 150-day moving average provided resistance at the start of 2013 and then the market declined and remained below its 50-day moving average for months. The 150-day moving average provided resistance again after the June bottom. Now that the market has reclaimed the 50-day moving average which has turned up, it is in position to break above the 150-day moving average which is flat and no longer declining. Keep an eye on the RSI which should push above 70 to confirm a breakout. Upon breakout, the medium term target becomes $31.
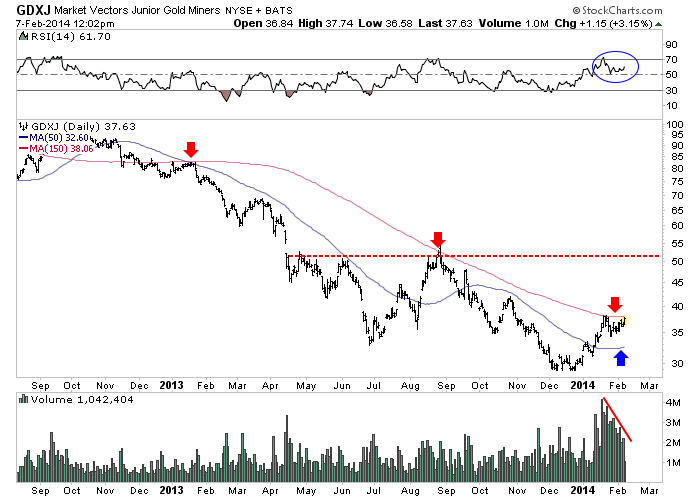
There is a similar picture in GDXJ. The market failed at the 150-day moving average in January 2013 and then remained below the 50-day moving average until August. The summer rally failed at the still declining 150-day moving average. Now GDXJ has reclaimed the now rising 50-day moving average and is in position to breakout above the 150-day moving average. The RSI recently hit 70 and has remained above 50 during this consolidation. It definitely needs to push above 70 in a breakout scenario. In the breakout scenario the medium target becomes $51.
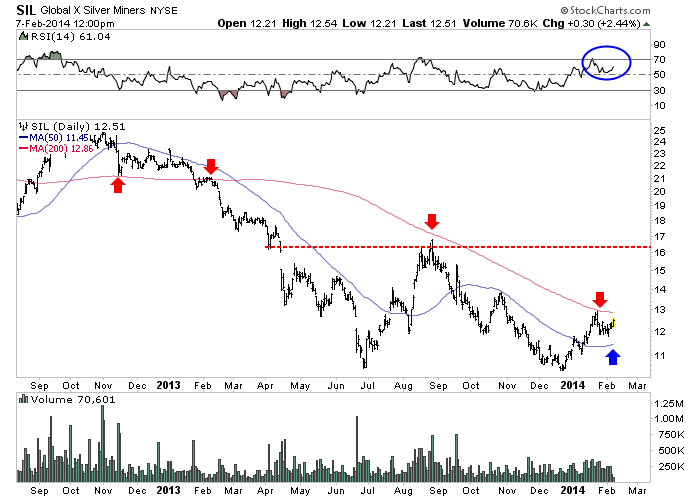
For SIL and the silver stocks we use the 200-day moving average. That average provided support in November 2012 but then resistance in February 2013 and then for the summer rebound in August 2013. SIL has now reclaimed the 50-day moving average and is in position to retest the 200-day moving average. Again, look for the RSI to confirm the breakout. In that scenario, the next resistance target becomes $16.50.
The near-term analysis is quite simple. The 50-day moving average appears to have become strong support for these markets which appear ready to test what has been resistance over the past 13 months. Note how that resistance (the moving averages) is no longer declining but is flat or flattening. That illustrates how the downtrend is all but over. A strong close above the moving averages will all but confirm that the downtrend is over and could more importantly lead to some very strong moves. GDX at $24 has an upside target of $31. GDXJ at $37 has an upside target of $51 while SIL at $12.50 has an upside target of $16.50. Keep an eye on these markets as a breakout above these moving averages would be quite significant.


