Sentiment in the entire precious metals sector is so low, that it almost seems as if it cannot move any further below its current level. This has profound implications for the market: levels so low signal the formation of a bottom and a likely trend reversal. We would like to quote one of the questions that we received recently, as it is a good indication of the negative attitude investors’ have towards the yellow metal, which could be used as a proxy for the whole sector due to strong correlations between particular assets.
When gold reached $1,900 in 2011 it was too much and too fast; we are making a big mistake thinking that gold will go higher. I expect that Wall Street equities will soar for the remainder of 2013 and gold will do very poorly. There are many good stocks now and one can do very well by investing in them.
However, my record for predictions of this sort is bad. I am hoping that this time my record will be horrible. If so, gold may go to $3,500/ounce.
Actually, this is how your editor feels as well. I can't say that I'm happy about the gold market and its performance at this point. Acting against such strong "feelings" historically proved to be profitable. Recall buying when there's blood in the streets principle?
We have already written about the extreme situation in the gold and silver mining stocks market, and it seems that there is even more tension in this market at present. The fundamentals and the negative sentiment at its peak bode well for investments in this sector. Let us move into today’s technical portion to see what charts have to say – we will starts with junior mining stocks (charts courtesy by http://stockcharts.com.)
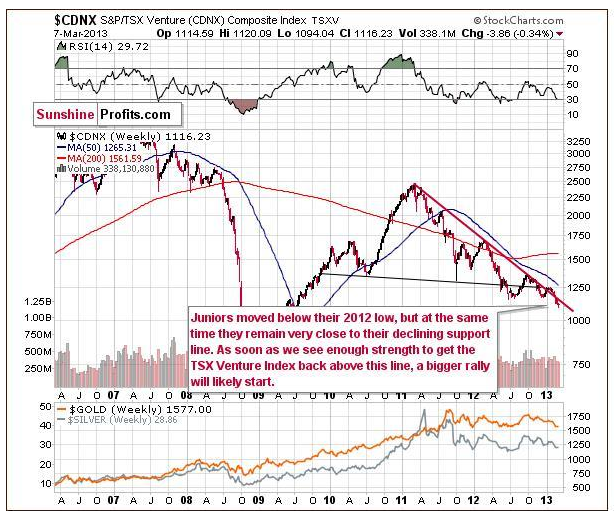
In the Toronto Stock Exchange Venture Index (which is a proxy for the junior miners as so many of them are included in it), we see a move below the 2012 low this week but prices are still close to this level. Since juniors are so close to the declining resistance line, once a bit of strength is seen here, a significant rally is likely to begin. As the saying goes, “the longer the base, the stronger the move”, and the base period here is about 6 months so the rally could indeed be powerful.
Let us now move on to gold mining stocks – we’ll use HUI Index as a proxy here.
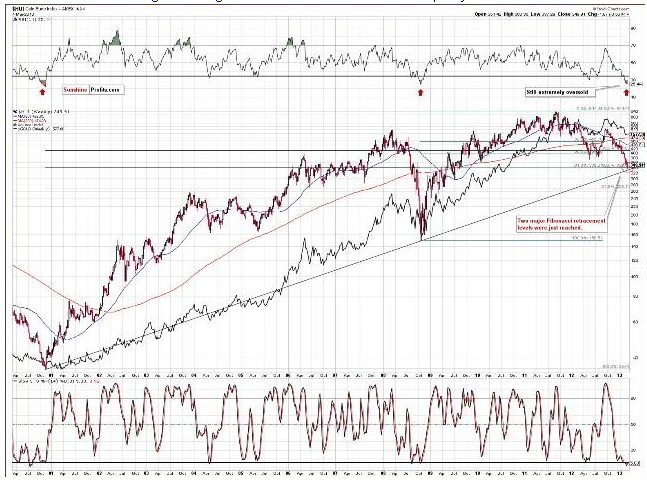
In this chart, which covers the whole current bull market for gold stocks, we can see that the support line created by the bottoms of 2000 and 2008 has almost been reached. The 50% Fibonacci retracement level of the 2000 to 2011 rally, where actually ½ of the whole bull market has been retraced is also a major support line in play. At the same time, we see the 61.8% retracement level of the 2008 to 2011 rally. Since these retracement levels were reached, the bottom could very well be in and the HUI Index may not move lower.
Please look at the indicators, at the top and bottom of the chart. The RSI has only been this oversold in 2008 and 2000 both at major bottoms. The stochastic indicator at the bottom was only this oversold back in 2000. The situation now is now even more extreme than 2008. A major bottom is likely in or very close to being in.
Let’s now move to a chart that measures gold stocks performance relative to the general stock market.
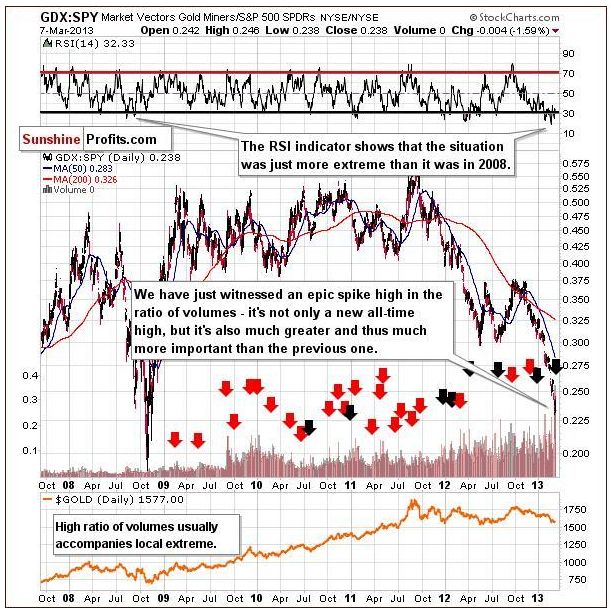
In this GDX:SPY ratio chart, we see a huge spike in the ratio volumes, actually much higher than ever before. A high ratio of volumes usually accompanies local extremes and we are surely close to a local bottom here, not a top. Clearly this could mark the end of the corrections in the entire precious metals sector not only the mining stocks.
To finish off, we’ll take a look at Gold Miners Bullish Percent Index.
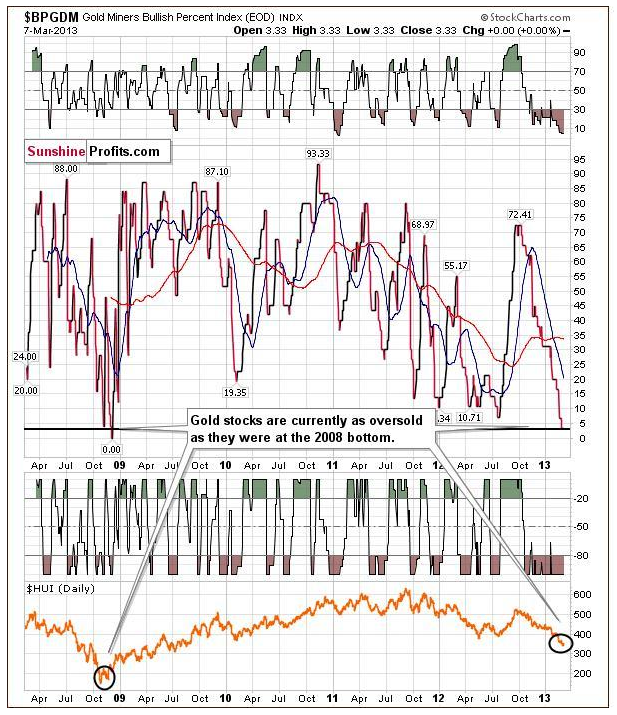
The Gold Miners Bullish Percent Index dropped below 5 last week. This has only happened twice before (ever - this index was created in 2008) early in November 2008 and early December 2008 - after both parts of the major double-bottom pattern. Naturally, implications are bullish, as this is yet another signal that the sentiment is now extremely negative for the whole sector.
This chart confirms that the situation is critical. When it has been as oversold in the past, the major bottom had already been seen and higher prices quickly followed. The implications here are clearly bullish for gold prices in the weeks ahead.
Summing up, the outlook for the mining stocks is becoming increasingly bullish with each passing week. Numerous signals this week point to a turnaround on the horizon and it appears that the miners will once again begin rallying, if they haven’t done so already.
By Przemyslaw Radomski, CFA
- English (UK)
- English (India)
- English (Canada)
- English (Australia)
- English (South Africa)
- English (Philippines)
- English (Nigeria)
- Deutsch
- Español (España)
- Español (México)
- Français
- Italiano
- Nederlands
- Português (Portugal)
- Polski
- Português (Brasil)
- Русский
- Türkçe
- العربية
- Ελληνικά
- Svenska
- Suomi
- עברית
- 日本語
- 한국어
- 简体中文
- 繁體中文
- Bahasa Indonesia
- Bahasa Melayu
- ไทย
- Tiếng Việt
- हिंदी
Gold And Silver Stocks In Extreme Situation
Published 03/10/2013, 12:07 AM
Updated 05/14/2017, 06:45 AM
Gold And Silver Stocks In Extreme Situation
Latest comments
Loading next article…
Install Our App
Risk Disclosure: Trading in financial instruments and/or cryptocurrencies involves high risks including the risk of losing some, or all, of your investment amount, and may not be suitable for all investors. Prices of cryptocurrencies are extremely volatile and may be affected by external factors such as financial, regulatory or political events. Trading on margin increases the financial risks.
Before deciding to trade in financial instrument or cryptocurrencies you should be fully informed of the risks and costs associated with trading the financial markets, carefully consider your investment objectives, level of experience, and risk appetite, and seek professional advice where needed.
Fusion Media would like to remind you that the data contained in this website is not necessarily real-time nor accurate. The data and prices on the website are not necessarily provided by any market or exchange, but may be provided by market makers, and so prices may not be accurate and may differ from the actual price at any given market, meaning prices are indicative and not appropriate for trading purposes. Fusion Media and any provider of the data contained in this website will not accept liability for any loss or damage as a result of your trading, or your reliance on the information contained within this website.
It is prohibited to use, store, reproduce, display, modify, transmit or distribute the data contained in this website without the explicit prior written permission of Fusion Media and/or the data provider. All intellectual property rights are reserved by the providers and/or the exchange providing the data contained in this website.
Fusion Media may be compensated by the advertisers that appear on the website, based on your interaction with the advertisements or advertisers.
© 2007-2025 - Fusion Media Limited. All Rights Reserved.
