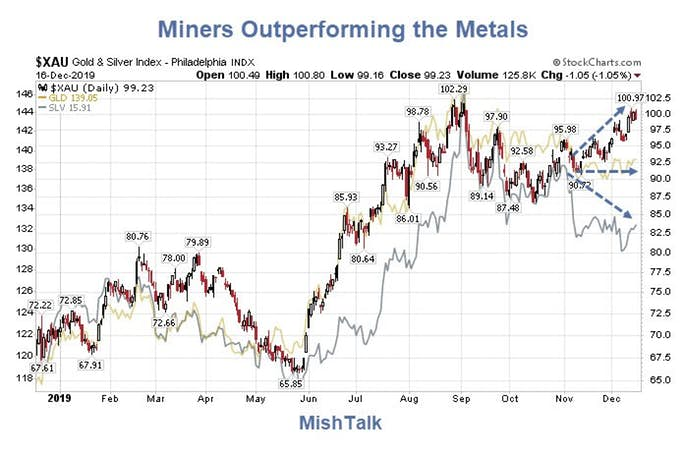
For the first time in a long time, gold and silver miners are outperforming the metal, generally a good signal for both.
Starting November, on a daily chart, the XAU components started outperforming gold and silver.
Miners Versus the Metals Weekly
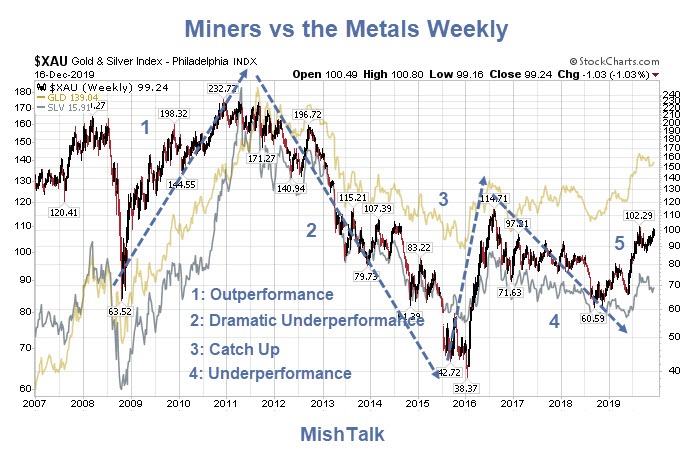
A weekly chart shows these periods of overperformance and underperformance can last a long time. Recent action in the miners is encouraging as are the technical charts.
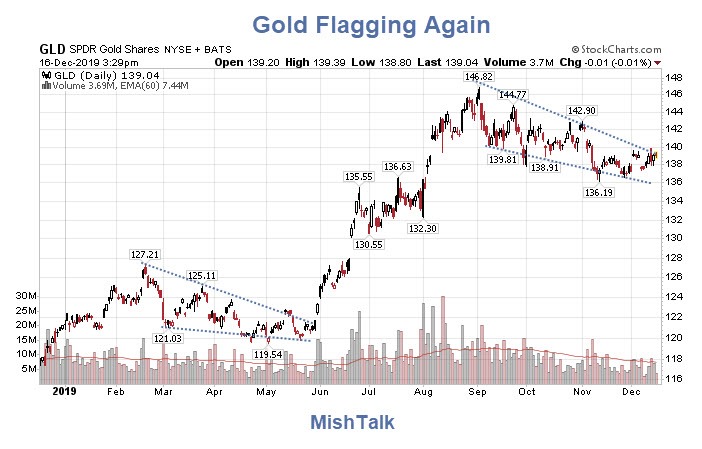
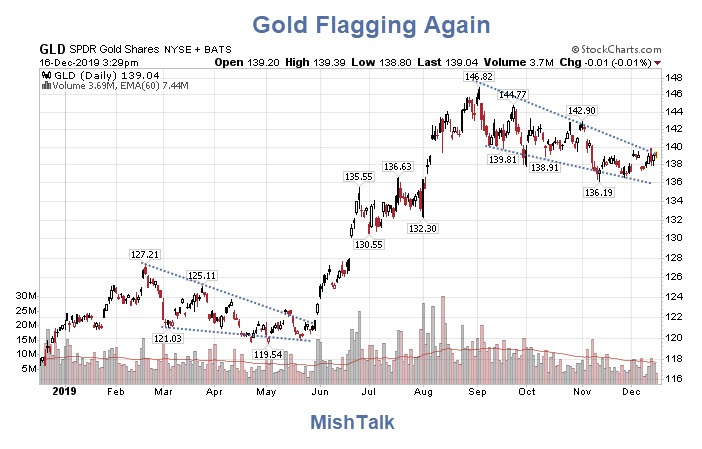
Gold Bull Flag
Silver Bull Flag
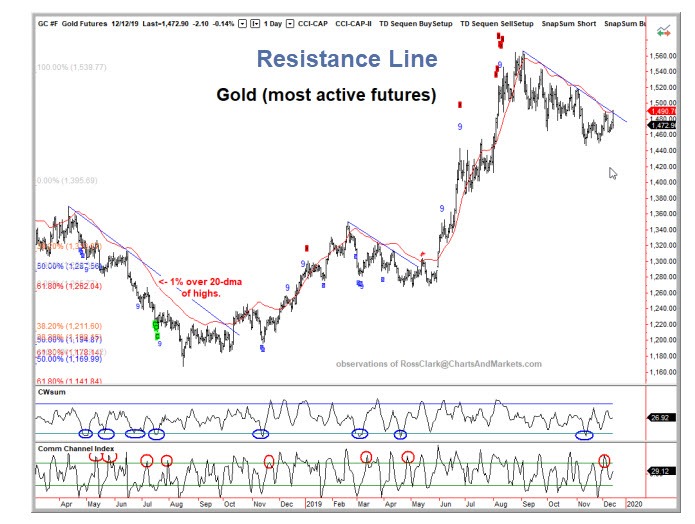
Retest of Resistance Line
Silver Bullish Divergence
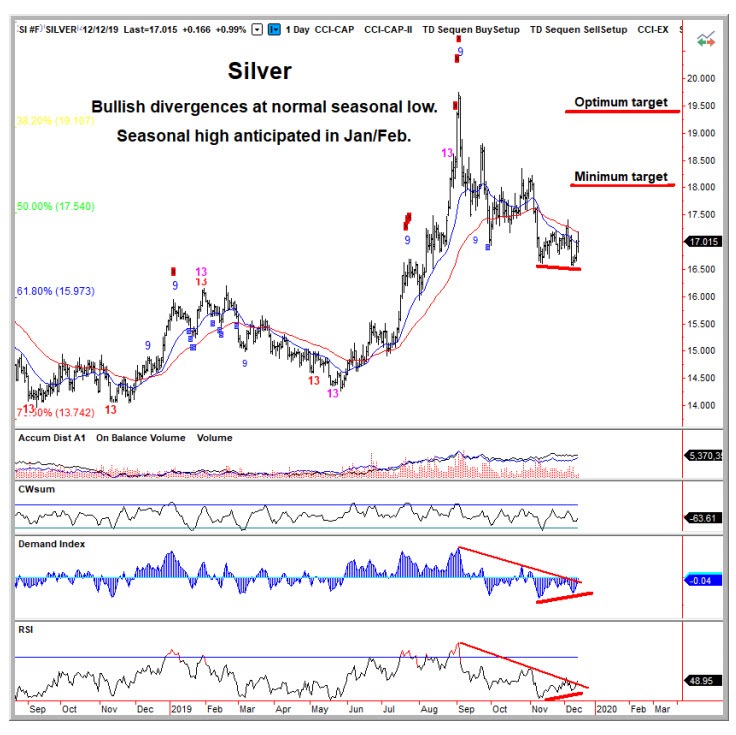
The preceding two charts are from Ross Clark at Charts and Markets, via Bob Hoye at Institutional Advisors. The numbers pertain to DeMark exhaustion signals, a method I do not follow, but many technicians do.
Clark's Opinion
Silver loves to take out supporting lows, creating a Wyckoffian ‘Spring’ and bullish divergence in the RSI just prior to rallies. We have such a divergence now.
In the last thirty years silver has managed to put in seasonal lows in November and December (7 and 18 times respectively). Seasonal highs have been in January and February (14 and 10 times respectively).
There were only four instances where silver prices continued to rally past March (2016, 2011, 2006 and 2004). Rallies most commonly advance around 17%. The smallest percentage gain was 9% with a few outliers in excess of 30%. If the $16.56 low of last week holds then we can anticipate a minimum target of $18.05 with a most likely target of $19.35. An optimum transaction would be a March call option with a strike price halfway to the target. Options are available for the futures contract and the SLV ETF.
Thanks to Ross Clark and Bob Hoye. The initial charts are mine.
