Investors have substituted their demand in gold and opted for the safety of the U.S. dollar. U.S. dollar index have risen from previous low of 79 to 83.59 with more room to the upside. After the April selloff, gold has rebounded initially due to a large physical demand that is offsetting the outflow in ETFs.
Major central banks have opted to do more quantitative easing, which offer support to own gold. The rebound rally is stalling after hitting a high of $1488 and the decline in price is mainly due to a stronger U.S. dollar, coupled with the return of the stock markets. As economic and geopolitical risk has been reduced, the need for the yellow metal has also been reduce.
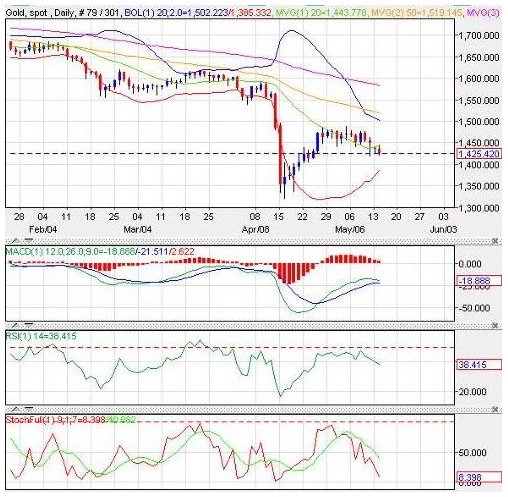
Technically, gold remains weak and biased to more downside pressure as the daily chart shows a falling stochastic and the MACD line, which is about to cross lower (trading in the negative zone). The RSI seems to indicate that gold has room to retest last week low at $1418 and should that break then $1404.
- Resistance: $1475, $1488, $1496, $1525
- Support: $1418, $1404, $1325
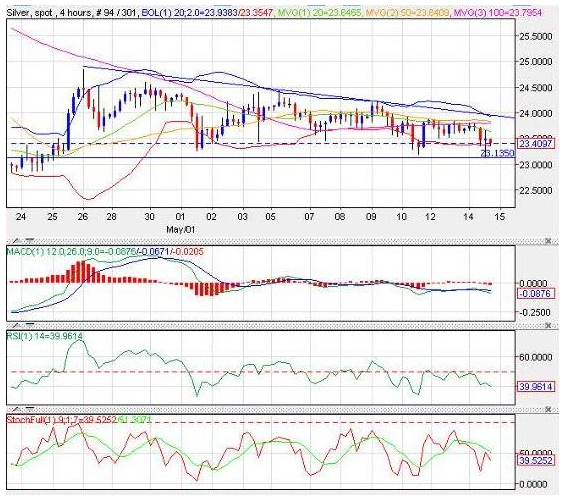
Silver continue to trade within a descending triangle channel with MACD threading in negative territory and the stochastic fast line showing potential downside pressure. The RSI continue to roll in the oversold area and silver has not been able to break higher after hitting a high on 4th May at $ 24.45.
In the short term, a break above $ 24.20 will be favourable for the bull as silver will trade outside of this formation and possibly test higher prices at either $ 25.03 (50% retracement) or $ 25.75 (61.8% retracement). The rebound rally lost its steam and silver has not really performed as well as gold. Technically, the daily chart shows a Bollinger band that is coming closer to a breakout. At the moment, the risk for further correction remains high.
