Talking Points
- Gold and Silver Continue Gains As The US Dollar Weakens Further
- Resurgence in Risk Aversion May Prompt Return To The Greenback
- Crude Oil Encounters Meaningful Resistance Amidst Broader Uptrend
Gold and silver continue to power higher as the precious metals space benefits further from broad-based US dollar weakness. Crude oil has also found strength in early Asian trading as a general drift higher in risk assets has bolstered the growth-sensitive commodity.
The US dollar has likely weakened as safe-haven demand for the reserve currency ebbs on abating concerns surrounding emerging markets. However, if we see a resurgence of risk aversion in the market, we may yet see traders return to the greenback, which would in turn weaken gold and silver.
The question remains – what will prompt a revival of risk aversion? Looking at the economic calendar several upcoming events are noteworthy, including the January FOMC meeting minutes. An aura of complacency surrounding “pro-taper” talk from Fed officials may be put to the test if the minutes reflect a decidedly less dovish disposition.
A souring of investor sentiment would also likely weaken demand for crude oil, as buyers may retreat on concerns about the pace of future US economic growth. However, aside from risk trends, physical supply and demand factors have also played meaningful role in driving crude higher. If cold weather conditions continue to contribute to a drawdown in distillate inventories (suggesting higher demand), WTI may be remain relatively well supported.
The Speculative Sentiment Index is suggesting a mixed bias for Gold.
CRUDE OIL TECHNICAL ANALYSIS:
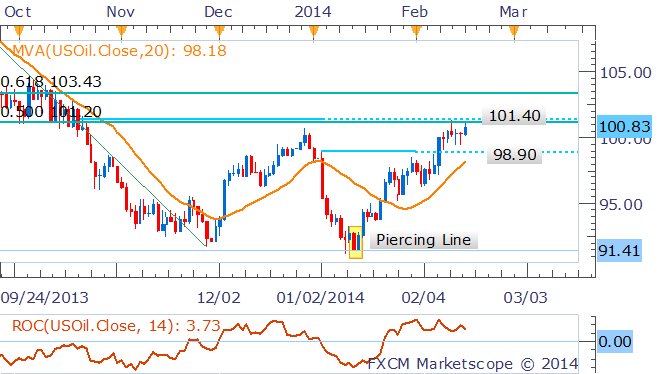
The uptrend highlighted in recent reports persists and earlier reversal signals have shown little follow through. A break above noteworthy resistance at $101.40 (the 50% Fib retracement level) would open up the $103.43 mark.

GOLD TECHNICAL ANALYSIS:
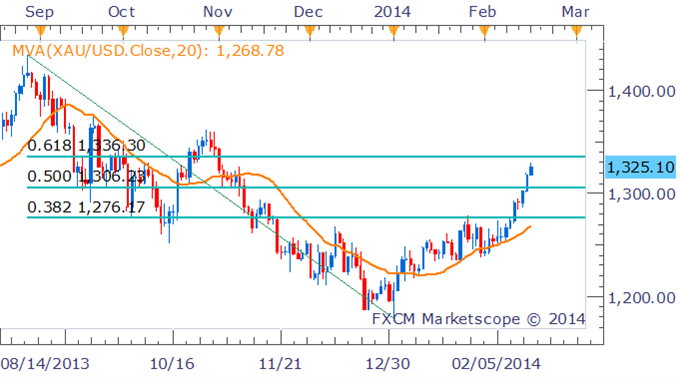
The bullish technical bias provided in recent reports has continued to play out with the uptrend in gold continuing. There appears to be little indication of a reversal from any candlestick patterns at this stage. However, with prices having moved significantly away from their 20 SMA, it suggests the gains may be overextended.

SILVER TECHNICAL ANALYSIS:
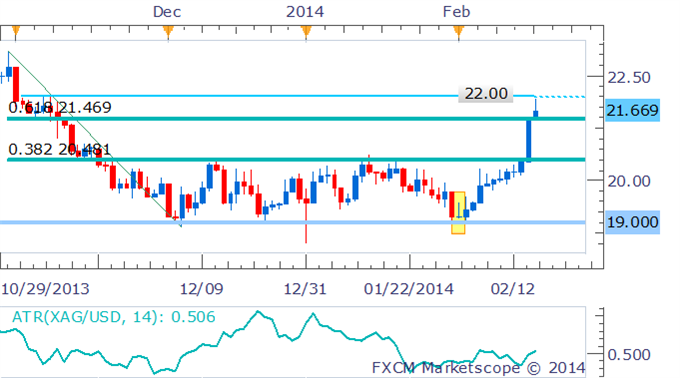
Silver has finally broken the trading range that kept prices contained between 19.00 and 20.48. With an uptrend having emerged, the upside is favored from a technical standpoint with noteworthy resistance resting at the psychologically significant $22.00 mark.

COPPER TECHNICAL ANALYSIS:
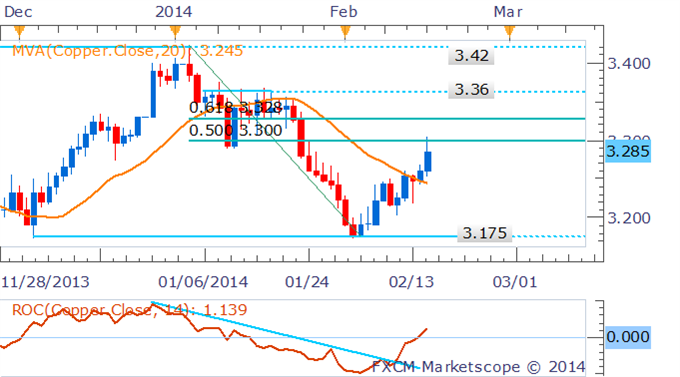
The short term trend has appeared to shift to the upside for copper, with prices moving above the 20 SMA and the rate of change indicator moving into positive territory. However, nearby resistance at the 50% Fib retracement level of $3.30 appears to be restraining further gains and may leave limited upside potential.
