Do you feel the Christmas spirit when it comes to the yellow metal and miners? Because we don’t. Multiple signs over the past few days point to bearish weeks ahead for gold and the gold miners. The VanEck Vectors Gold Miners ETF (NYSE:GDX) – the most liquid vehicle for investors and traders to gain exposure to gold mining companies – is indicating that things are only about to go downhill from here, and a lack of action from options traders only serves to confirm that.
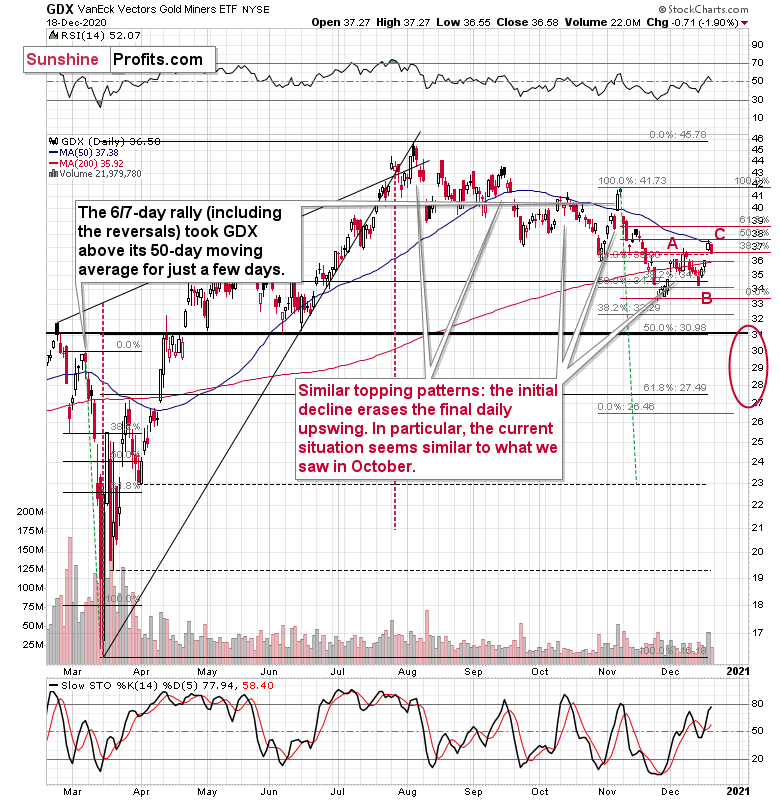
Despite rallying by 8.7% over a three-day stretch, the GDX traded sharply lower on Friday (Dec. 18), and yet again, failed to recapture its 50-day moving average (unlike gold). Moreover, GDX also closed below its early-December intraday high, while the GLD (NYSE:GLD) ETF remained above its analogous price level.

The relative weakness (miners underperforming gold) supports the following bearish thesis:
While gold corrected about 61.8% of its November decline, gold miners declined only half thereof. In other words, they underperformed gold, which is bearish.
The GDX ETF moved to its 50-day moving average – the level that kept its rallies in check since early October. Can miners move above it? Sure, they did that in early November, but is it likely that such a move would be confirmed or followed by more significant strength? Absolutely not. Let’s keep in mind two things:
- Back in early November, the GDX moved above the 50-day MA, when gold did the same thing, so if the GDX wanted to rally above this MA, it “should have” done so yesterday. It was too weak to do it.
- The early-November move above the 50-day MA was invalidated in just two days.
Moreover, please note that the performance of the GDX ETF from late-November to now looks like an ABC correction. This is not a bearish sign on its own, but it fits other indications described today and this week in general. It increases the chance that the top is already in or very, very close.
Another important development was the spike in volume during last Thursday’s (Dec. 17) upswing. It resulted in the largest number of GDX shares traded since the Nov. 6 top (on days when GDX is positive), and we all know what happened to GDX after Nov. 6 (As a point of reference, the four other highest volume days since the Nov. 6 top coincided with declines of 6.13%, 2.74%, 3.40% and 4.29%).
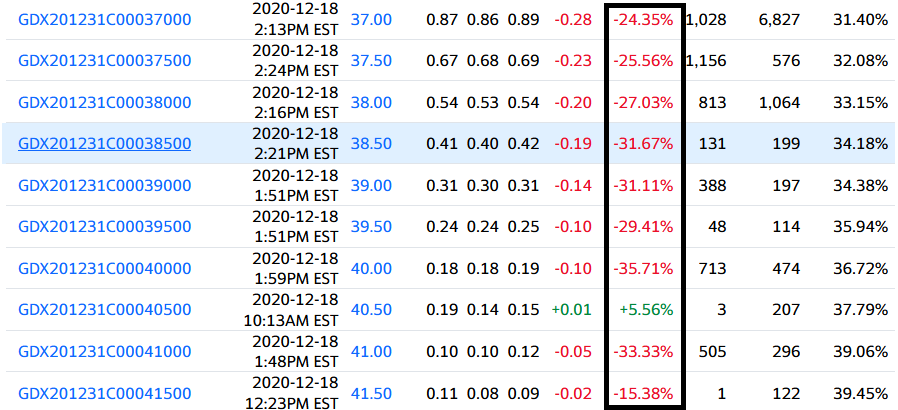
In addition, options traders aren’t buying GDX’s rally. Despite put options (which profit when GDX declines) trading relatively flat, call options (which profit when GDX rallies) traded at a significant discount last Friday. Please take a look at the table below for details (courtesy of Yahoo! (NASDAQ:AABA) Finance)

The lack of demand among options traders is another signal that last week’s rally is unlikely to continue.
Lastly, I’d like to share with you some thoughts on price targets.
How high could miners go? Perhaps only to the previous lows and by moving to them, they could verify them as resistance . The previous – October – low is at $36.01 in intraday terms and at $36.52 in terms of the daily closing prices. No matter which level we take, it’s not significantly above the pre-market price of $35.76, thus it seems that adjusting the trading position in order to limit the exposure for the relatively small part of the correction is not a good idea from the risk to reward perspective – one might miss the sharp drop that follows. Please note how sharp the mid-November decline was initially.
That’s almost exactly what happened – the GDX ETF rallied to $36.92 in intraday terms, and to $36.50 in terms of the daily closing prices. The breakdown was verified in terms of the daily closing prices, which is more important than what happened in intraday terms.
Consequently, the outlook is bearish as it seems that miners are ready for another move lower. There’s still a chance that the precious metals sector would move higher based on a possible short-term decline in the USD Index, but this chance is slim, especially given today’s pre-market decline in both the USD Index and gold.
The next downside target for the GDX ETF is the February top in terms of the closing prices – $31.05.
