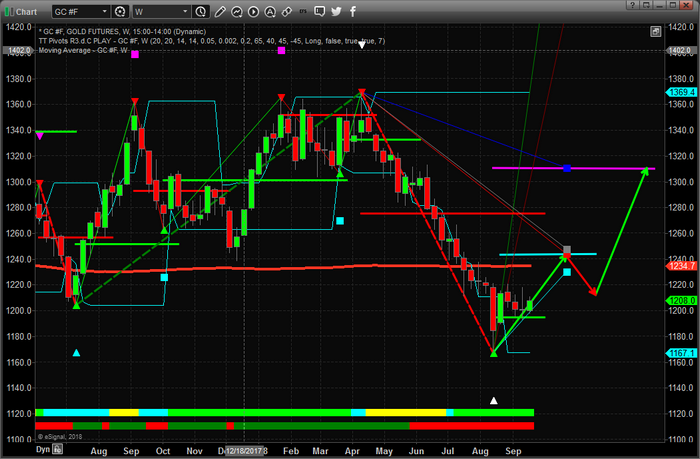
After many weeks of pricing pressure as the US Dollar extended a rally delivering nearly unending devaluation pricing in most commodities, Gold is setting up for a big upside rally and is likely to extend beyond $1240 in this initial run higher. We believe the immediate bottom has formed in Gold and we believe the upside move will consist of two unique legs higher. The first leg is likely to run to near $1240~1250 and end near the middle of November 2018. The second leg of this move will likely run to near $1310 and end near May 2019.
This move is the precious metals and miners will likely coincide with some moderate US Dollar weakness as well as extended global market concerns related to the trade war with China, economic factors originating from China and the EU as well as concerns stemming from the existing emerging market issues. The bottom line is that all of these global concerns are setting up a nearly perfect storm for Gold, Silver and the mining sector to see some extended rallies over the next 6+ month – possibly longer.
This Weekly Gold chart shows our proprietary Fibonacci price modeling system and we’ve highlighted key price points that are currently being predicted as targets. The CYAN colored line on this chart (near $1245) shows a number of key Fibonacci projected price levels align near this level. These coordinated price targets usually result in key price levels that price will target. So, $1240~1250 is setting up as our first upside target.
The second key level is the MAGENTA level near $1300. This lone target well above the other aligns with historical support going back to October/November 2017.

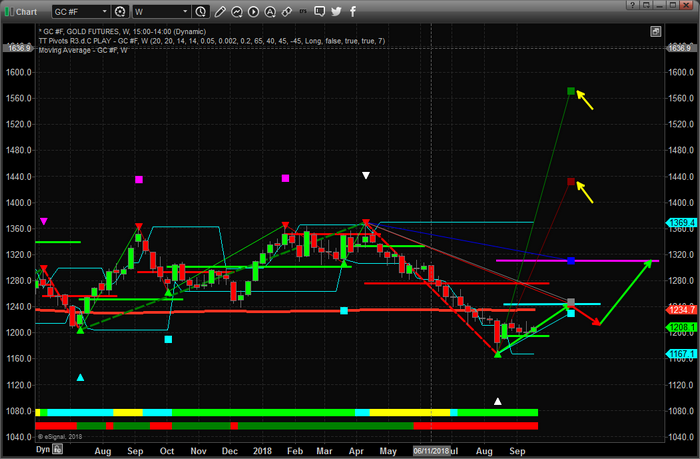
Ultimately, our Fibonacci price modeling system is showing projected price targets as high as $1435 and $1570 – see the YELLOW ARROWS on the chart below. These levels are valid targets given the current price rotation and the potential for these levels to be reached, eventually, should not be discounted. Our Fibonacci price modeling systems are adaptive and learns from price activity as it operates. It identifies these levels based on price activity, relational modeling and active learning of Fibonacci price structure and price theory. We believe these levels will become strong upside targets over the next 12+ months which indicates we have a potential for a massive 18% to 30% upside potential in Gold.

