Fun with Positioning and Sentiment
Last week we discussed the gold sector “conundrum” – the odd fact that there is apparently quite strong demand for gold despite a macroeconomic environment that would normally be considered quite bearish for the metal. Gold recently seems to have lost its last remaining inter-market “ally” if you will, as the dollar has begun to enter an uptrend as well. Positioning data in precious metals futures are nevertheless rather remarkable, given the relatively benign price action in gold and silver. The mood in the sector has turned quite gloomy for no obvious reason.
Below is a chart of the legacy CoT report data detailing net hedger and net large speculator positions in gold futures. These positions have reached levels that have in the past often marked lows, particularly under bull market conditions. The italicized qualification is important, as very different levels can be seen in bear markets. If one is bullish on gold, one should actually hope that large speculators as a whole don’t become too bearish – that is usually not a good sign.
On the other hand, these positions have to be brought into context. The main context in this case is prices. In other words, we are putting some weight on the impact changes in speculative positioning have on prices. We were astonished to see that gold is following a pattern we have previously observed in silver: a lot of bearish sentiment was expressed in a shift in positions despite prices exhibiting quite a bit of resilience by the standards of recent years.
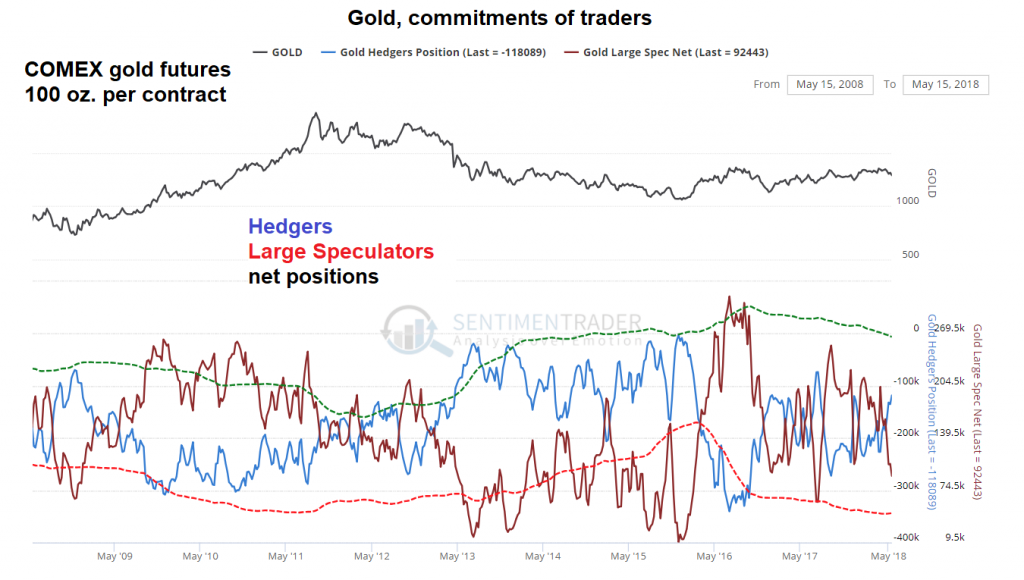
Legacy CoT report: last Friday the CFTC reported that the net long position of large speculators had decreased to ~92440 contracts, while the net short position of hedgers had decreased to ~118,000 contracts. Almost exactly the same configuration was last in evidence on December 27, 2016 – both the speculative net long position and the hedger net short position were actually slightly larger then (the gap was 8,000 contracts wider). At the time gold traded slightly above $1,138 per ounce, as opposed to $1,291 when the most recent snapshot was taken. That is almost a $153 difference – one would normally expect the mood to be a bit more upbeat.
The situation is even more glaring when considering the managed money category from the disaggregated CoT report. This group includes CTAs, hedge funds and the like, and we would consider most of them technical traders, this is to say, trend followers. In other words, one would expect that most of them aren’t overly concerned over the fundamental backdrop. And yet, in recent years they have rarely been gloomier than they are now.
This is a parallel to the silver futures market, in which extreme negativity on the part of large speculators has been de rigeur for more than half a year by now, while prices have barely budged and no major technical supports have been broken. Here is an up-to-date chart showing the net and gross positions of the managed money category in gold futures:
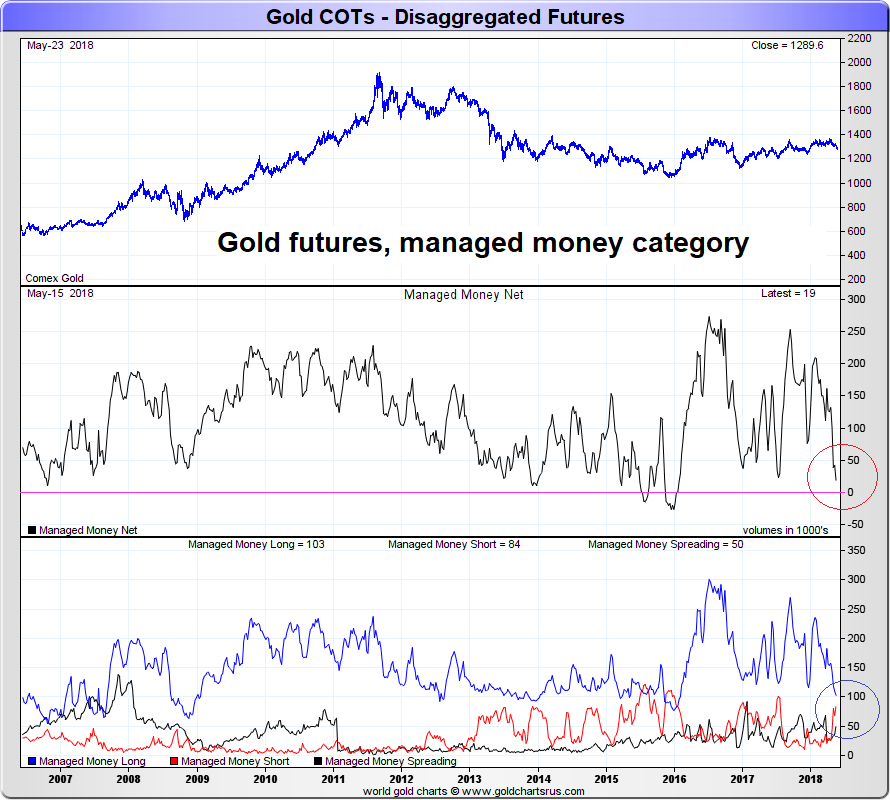
The net long position of the managed money group in gold futures has in the meantime declined to just ~19,000 contracts. What the net position doesn’t show, but the gross position data in the bottom panel does, is that this was recently not only due to capitulation by longs, but also due to shorts getting confident and piling in with gay abandon. Of course this not necessarily a good thing – as the chart reveals, bears were similarly confident during the 2013 – 2015 downtrend and were quite correct – until they weren’t anymore in late 2015. Once again, all if this has to be put into context. At this juncture we would say that the fundamental macroeconomic context currently favors the bears – but market-based signals seem to be on the side of the bulls.
Suspicious Silver Signal Squiggles
The concluding remark in the chart caption above requires that we take a look at silver as well. Readers may recall that we pointed out last week (see the paragraph above the first chart) that precious metals indexes have tended to move in tandem with silver rather than gold for quite some time – despite the fact that their constituent companies are predominantly gold miners rather than silver miners.
We believe this may be yet another side effect of the popularity of passive investment strategies, as several primary silver mining stocks are large constituents in ETFs tracking base metal producers (don’t ask us why). Then again, the most recent phase of significant outperformance in gold stock indexes in early 2016 took place when the macro-fundamentals had temporarily turned somewhat more gold-bullish as well, so the rally actually made sense from that perspective – at least to some extent.
The qualifier is based on the fact that the gold indexes and gold itself turned up right around the time when this somewhat more bullish backdrop had essentially reached its pinnacle and was about to deteriorate again. But the markets don’t have to make perfect sense all the time and they often don’t. The fact remains, precious metals stocks and silver have been tied at the hip since around mid 2012 (!). Here is a weekly chart of silver and the HUI since the 2011 peak in the silver price illustrating this correlation:
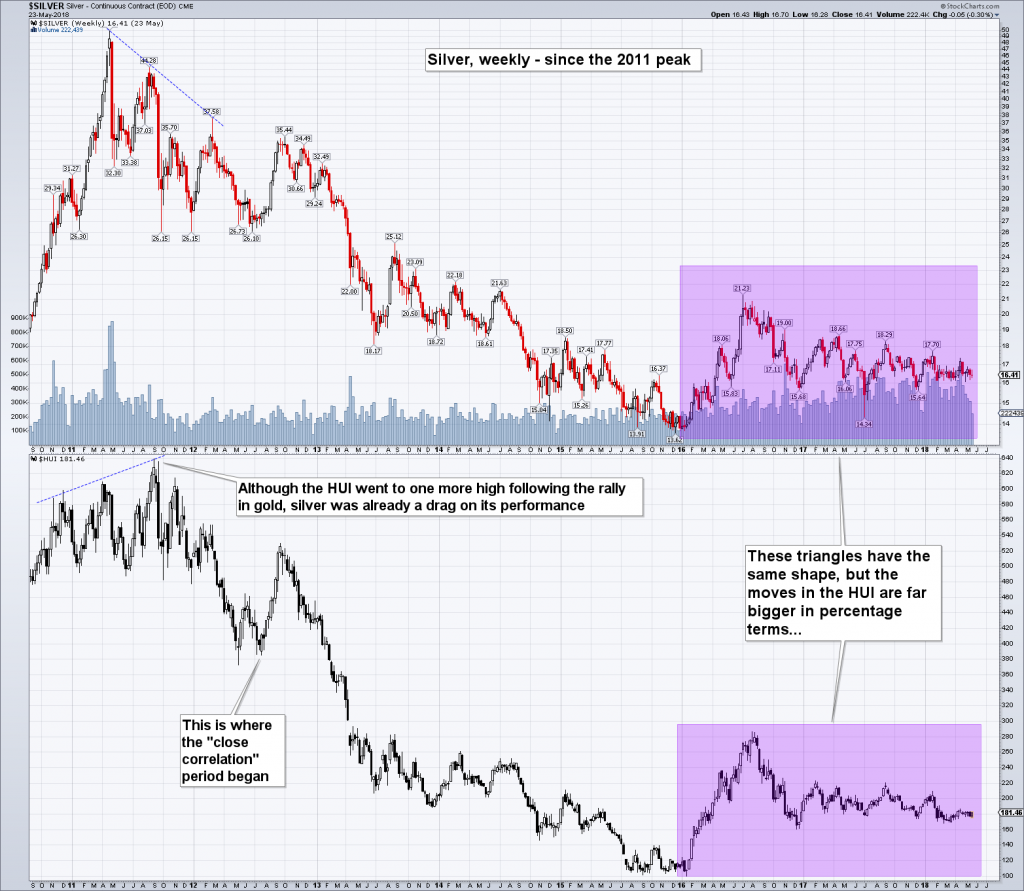
Silver and the HUI, weekly: since mid 2012, these two markets have tracked each other very closely. The moves in the HUI are larger percentage-wise, but the wave shapes are basically spitting images. It is almost as if the gold market didn’t exist.
What is particularly interesting in this context is the sentiment expressed by the recent positioning of speculators in silver futures. One would be tempted to think an asteroid laced with a few billion tons of silver had landed on earth, but that is actually not the case as far as we know. Large speculators recently (to be precise, on April 03) held a record net short position in silver futures (funny enough, a little over a year ago they held a record net long position):
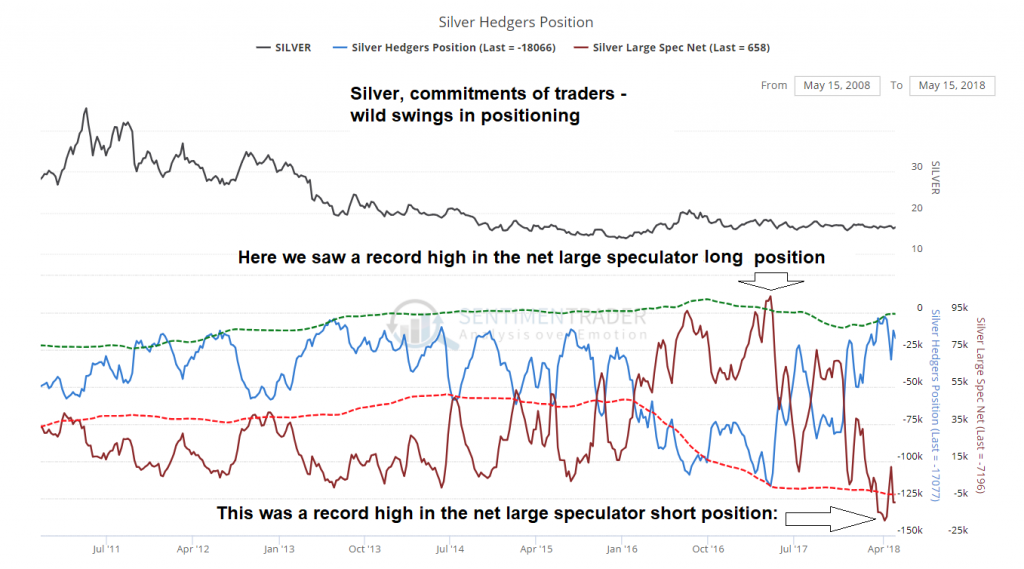
On 03 April, large speculators held a record net short position of 16,965 contracts in silver futures, with silver trading at $16.42.
Speculators as a group are almost never net short silver. To see their net short position climb into five digit territory is very rare indeed. Consider that the previous record net short position which they held at the very depths of the 1990s bear market (in late July of 1997) amounted to 10,379 contracts – a level not exceeded again until early this year.
Incidentally, in the very week in which the previous record in the speculative short position was posted in 1997, the infamous “Buffett rally” began, which pushed silver prices up by around 70% over the ensuing two months (we are not saying the same has to happen again, but perhaps this historical curiosity should be seen as a bit of a heads-up).
Here is a brief list detailing a number of historical extremes in speculative silver futures positioning (all net short positions, apart from the 2017 record net long position) :
Legend: H = hedgers, LS = large speculators.
2001 – 2003: a secular low in silver was made in this time period:
May 15, 2001: H: -8,857
LS: -1,461 silver price: $4.32
July 17, 2001: H: -7,746
LS: -2,586 silver price: $4.25
April 01, 2003: H: -15,845
LS: -3,680 silver price: $4.43
2017:
April 18, 2017:
this is the record high speculative net long position that was reached a little over a year ago, highlighted in the chart above:
H: -116,832
LS: +103,887 silver price: $18.30
2018:
Feb 27, 2018: H: -14,463
LS: -1,508 silver price: $16.43
April 03 2018:
this was the day of the new LS record net short position (obviously there was a string of record highs in the run-up to April 03 – altogether five conseciutive weeks with net short positions in excess of 12K contracts):
H: -2,637
LS: -16,965 silver price: $16.42
May 01, 2018: H: -11,978
LS: – 7,196 silver price: $16.17
1997: the year of the previous record LS net short position:
July 29, 1997: H: -4,770
LS: -10,379 silver price: $4.34
An interesting aside to all of this is of course that the gold-silver ratio – once again in seeming defiance of the macroeconomic backdrop it should be noted – was recently close to the highest levels it tends to reach historically, namely slightly above the 80 level (if memory serves there was an outlier in early 1991 when it briefly streaked to 100, but that seems to have been a one-off).
Now, before you rush out to mortgage the farm and sell some of your less popular relatives into slavery to stack up real big on silver and grab a few obscure five-letter exploration stocks in size, consider a caveat of a general nature: in recent years futures positioning data have undergone large changes in a number of markets – this is to say, goal posts and limits long considered inviolable have shifted markedly. The QE era has produced new extremes in all sorts of financial instruments and futures markets are no exception.
Along similar lines, the financilization of commodities and the shift toward passive investing have generated both opportunities and potential minefields. The full effects of this have probably not played out yet, although we believe the precious metals sector in particular has already experienced significant negative and positive effects in the form of exaggerated moves.
There are two more charts we want to show in connection with silver – the first one is a chart of the legacy commitments of traders in the generally bearish 1990s (excluding the Buffet rally), with the previous large speculator record net short position and its aftermath highlighted:
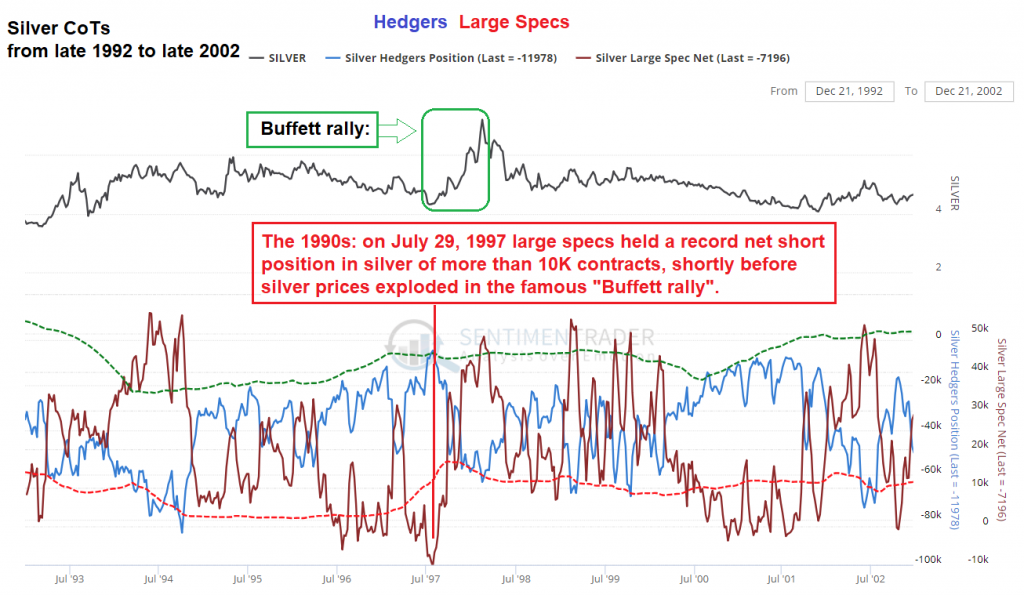
Silver – legacy commitments of traders (hedgers and large speculators) from late 1992 to late 2002: in late July 1997 speculators adopted a very bearish stance at the wrong moment. Two months later they had become very bullish, also at the wrong moment as it turned out. It is important to note though that there were time periods when a fairly large percentage of the larege speculator group was correctly positioned (as tends to happen in trending markets). It is only the very extremes that happen to coincide with or are slightly leading major turning points.
By the way, if you wonder about the “managed money” category: in silver futures it is currently net short by a historically still quite large 17,000 contracts – down from a record net short position of around 40,000 contracts in early April. A fly in the ointment is that small speculators have become more enthusiastic as the year has progressed and currently hold an offsetting net long position of almost the same size (although it remains about 50% below the historical record, which oddly enough was set in 1993/4 and revisited in 2002).
Lastly, with respect to the silver front, here is a close-up of the silver-HUI triangle highlighted in the weekly chart further above. What makes this interesting is that despite the close correlation between silver and the HUI, numerous short term price divergences (alternating lower vs. higher lows and vice versa) have occured in recent months. More often than such divergergences tend to be a positive sign.
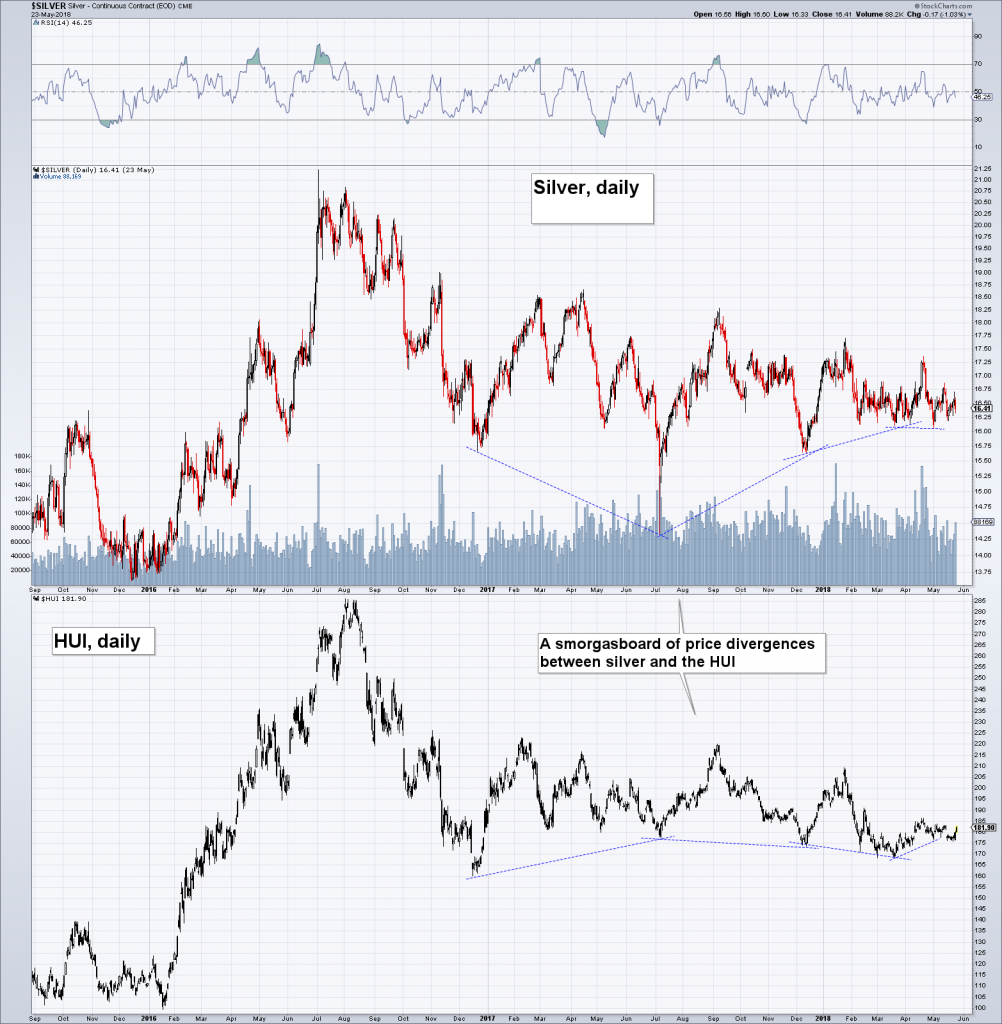
HUI and silver daily since the early 2016 low: several diverging lows have occurred in the sideways move since late 2016.
Gold Surveys and Gold in Foreign Currencies
In closing we will look at a few more gold-related data series: here is a long term chart of the Optix (“optimism index”, which combines gold sentiment survey data with positioning data). We want to remind readers of something we have previously mentioned in connection with the Optix – take a close look at the three types of market environments we have highlighted on the chart:
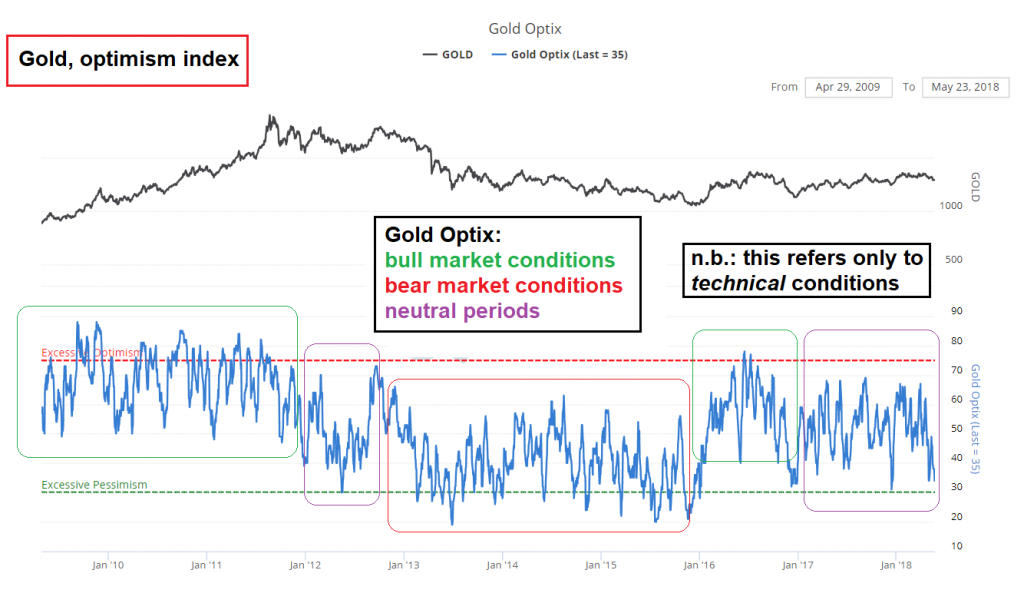
The Optix moves in different ranges depending on the market environment – it is therefore more than just an overbought/oversold indicator. In bullish conditions it tends to frequently spike above the “excessive optimism” threshold and generally fluctuates within a higher range; the opposite happens in bearish market conditions, i.e., the “overbought” and “oversold” thresholds will shift to a lower range. What is relevant with respect to the current situation is that in neutral conditions, it tends to bottom just above the “excessive pessimism” threshold – which is close to where it currently resides (it also peaks at levels above the upper threshold in force in bearish periods). Note here that “bullish”, “bearish” and “neutral” conditions refer only to the price trend, fundamentals are not taken into account – in other words, relevant is only whether an uptrend, a downtrend or a sideways trend prevails.
What we said about the Optix in our previous discussion of the indicator still applies: gold bulls want to see it move into a higher range, and eventually begin to generate frequent “overbought warnings”. While its recent range is neither here nor there, provided “neutral conditions” continue to be in force, it is now close to giving a short term buy signal.
The next chart is a weekly chart showing gold priced in non-dollar currencies, namely the Japanese yen, the euro and the South African rand (the latter is important for gold miners domiciled in SA). We can state: there simply was no gold bear market in JPY – all that happened was an extended sideways consolidation. There was a minor bear market in EUR, but it ended in late 2013 – a full two years before it ended in USD terms. A slow, but steady recovery is underway since then (it may be about to get an Italy-inspired boost).
Ironically, over the past two years gold was particularly weak in ZAR terms, as the Rand strengthened in the wake of the ouster of president Zuma last year. This is quite normal though – the rand is traditionally quite volatile (and there are advantages to periods of currency stability even for SA-based gold miners). We would actually argue that based on the history of the rand gold price, it is likely that its current price spells opportunity (note that previous resistance has become support).
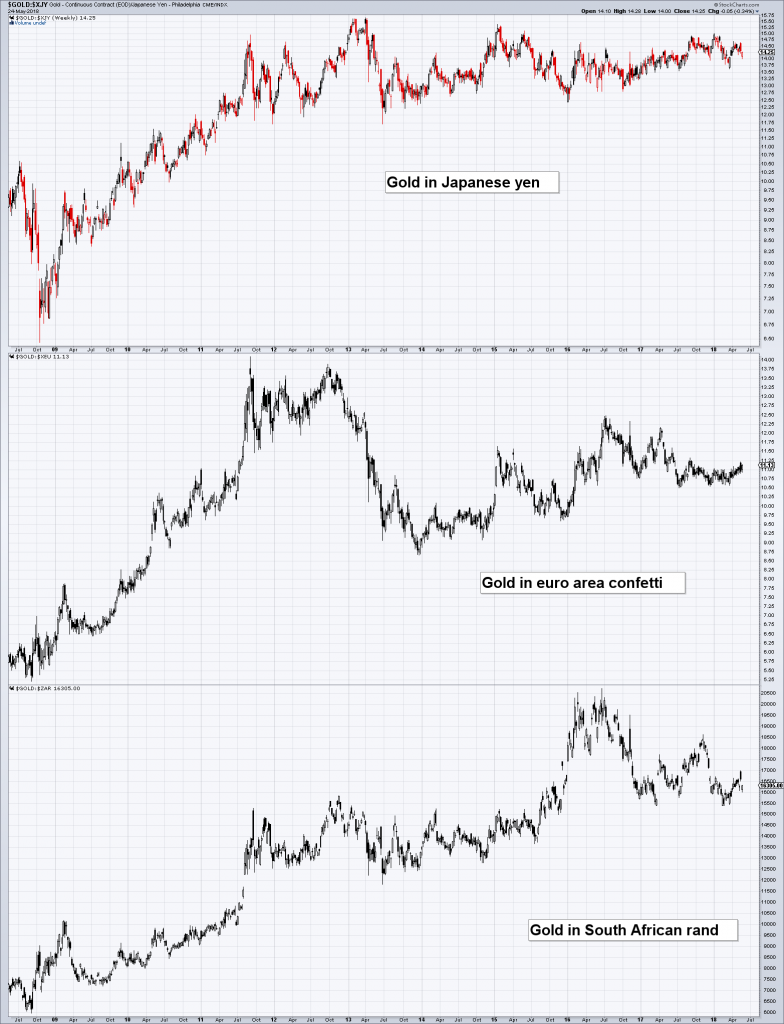
Gold in two major currencies and one EM currency – bear market hard to detect.
Relative Performance – A Character Change in the Works?
The next chart shows the relative performance of gold, silver and the HUI since late 2016 – these normally correlated assets have drifted ever further apart return-wise since then, with the HUI underperforming both gold and silver significantly, and silver underperforming gold.
This is typical bearish behavior, but if one makes the same measurement from the early 2016 low in the HUI, things look of course quite different. However, it is the consolidation over the past 18+ months that is of importance to us here. Since the “stealth recovery” in the HUI-gold ratio since mid March has continued so far, there is a possibility that an inflection point is actually near.
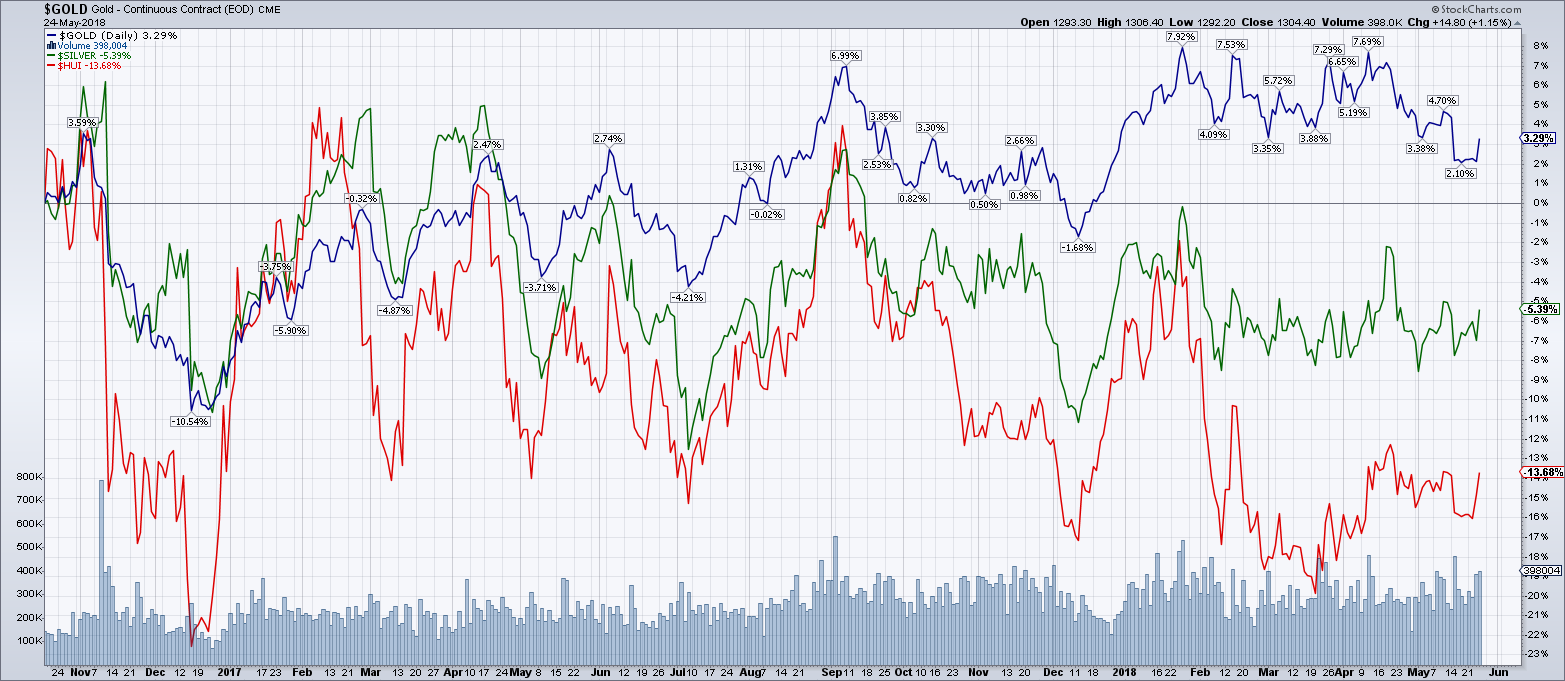
Gold (blue line) vs silver (green line) vs HUI (red line) since late 2016. The relative performance gap has widened quite a bit, but it is bound to eventually invert again.
If one examines this chart closely, something stands out – at least it does to us. The move in the HUI from the seasonal rally peak in late January into the mid-March low has all the hallmarks of a mini-capitulation (of the “disinterest type”).
What is interesting is what has happened since then – the time since mid-March is the only time period on the chart in which the HUI has actually resisted developing weakness in the metals and is showing a little bit of strength without support from rising gold/silver prices (even if it is not a lot of strength just yet). Per experience such developments are meaningful, even if the initial show of strength is erased again and the back-and-forth resumes.
We discussed analogous situations ad nauseam in the second half of 2015 and while a lot of patience was still needed until the market finally made its move, it was well worth paying attention, as a scorching rally ensued in first half of 2016. A few charts worth reviewing in this context can be found in “How to Recognize an Emerging Bull Market” which we published at the time.
There are patterns that seem to recur after every lengthy consolidation in the sector, particularly with respect to the behavior of the XAU and/or HUI when they begin to tackle the 200-day moving average from below (the charts show several pertinent historical examples). It always starts out the same way – with numerous rally attempts that fail in the vicinity of this demarcation and a succession of capitulation-type declines in the wake of these failures.
Since the past 18 months in the HUI look like just such a process, one should pay attention and be on the lookout for signs of a character change in the market. The recent bout of “stealth strength” is such a sign, even if the character change is not very pronounced yet.
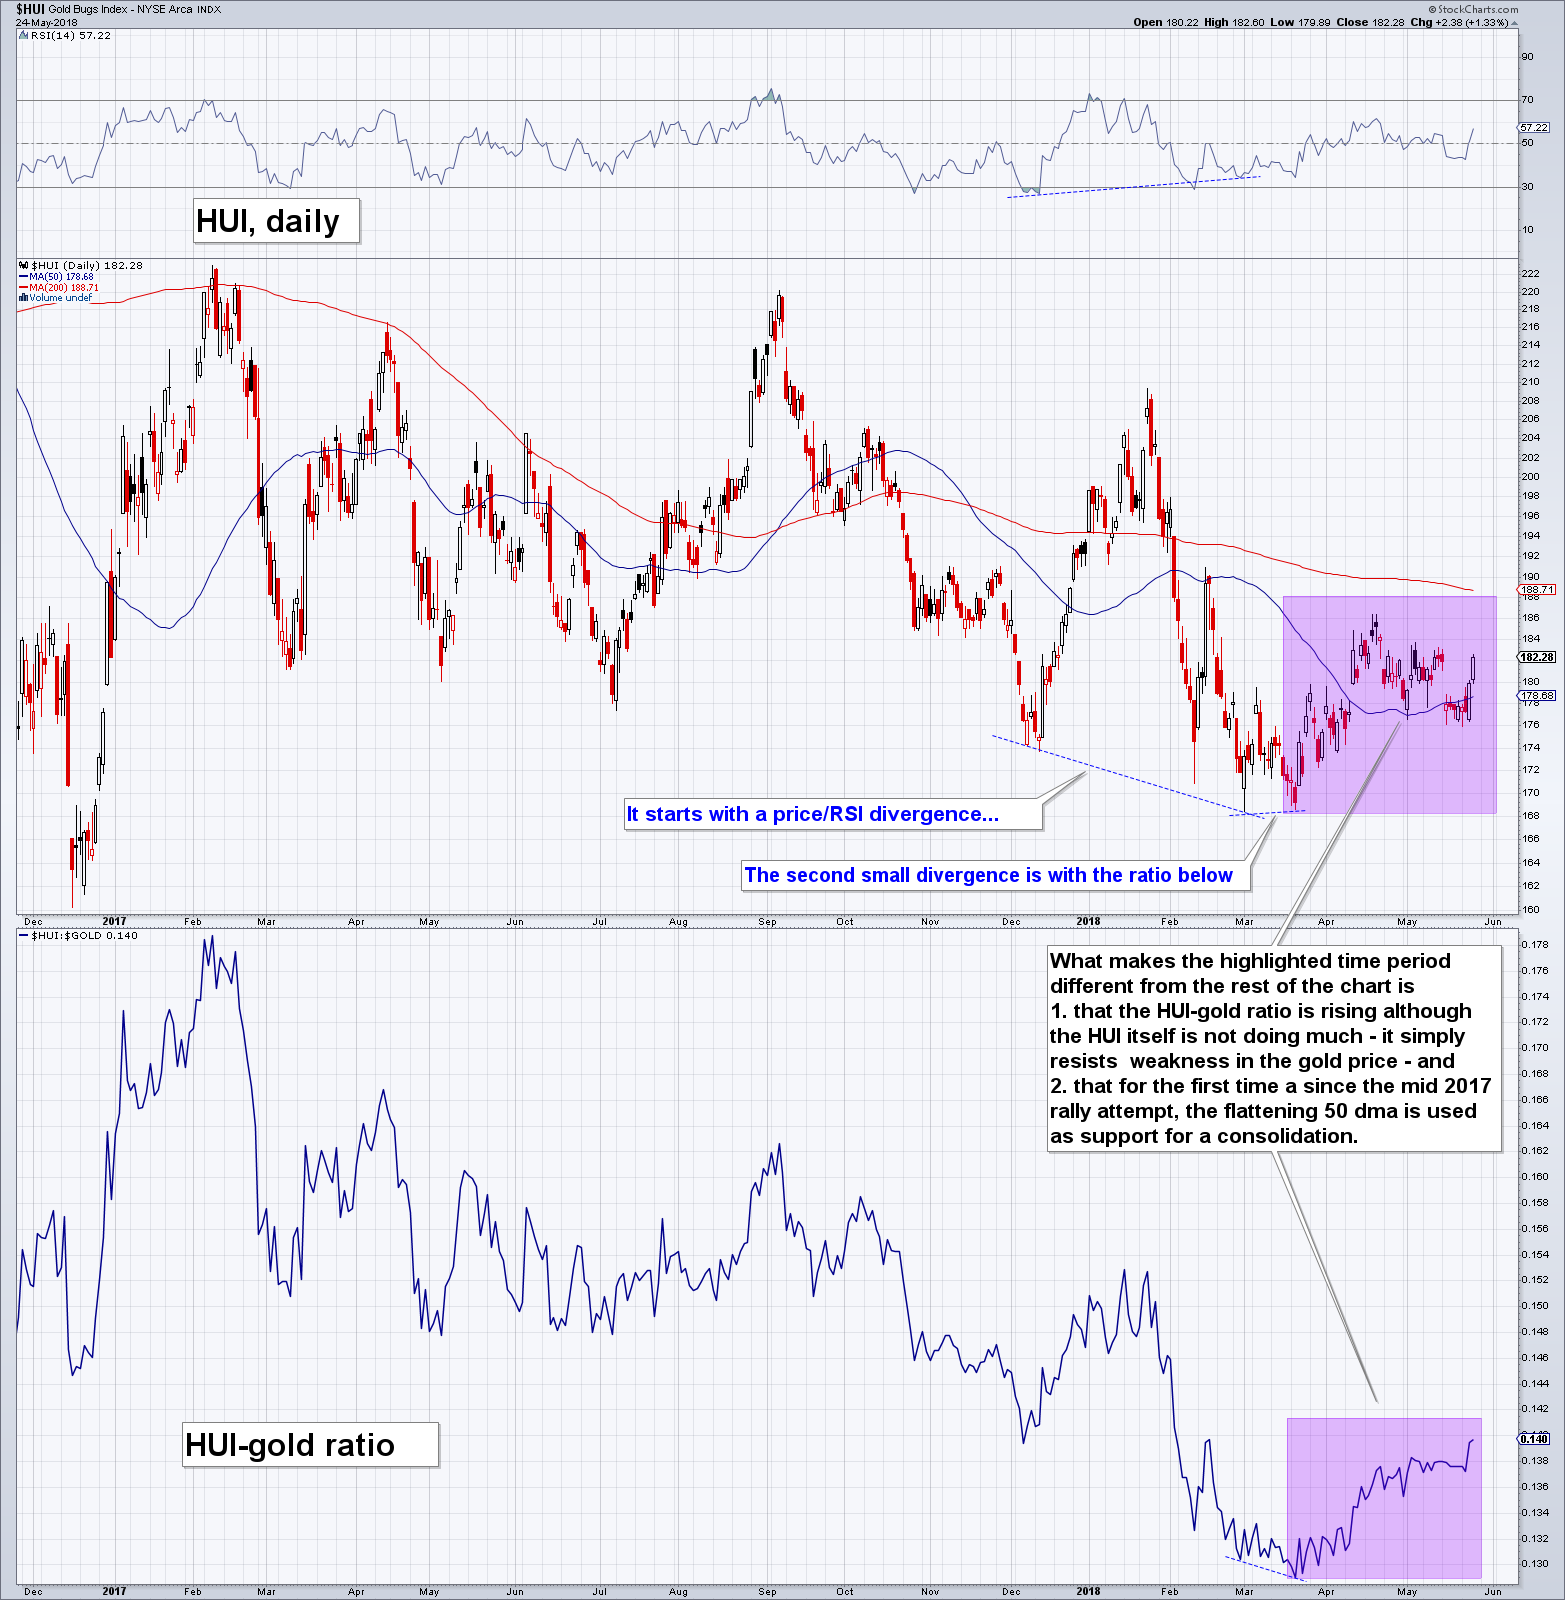
Admittedly, the positive evidence is still quite scant – it won’t take much for it to be erased again. The important point is mainly that something differerent from the preceding 1.5 years is currently happening. That is how trend changes begin, regardless of how stable the initial signs of change turn out to be in the short term.
We hope we haven’t jinxed it for another six months merely by saying all that. Unfortunately that is entirely possible, particularly in view of the still questionable fundamental backdrop… then again, if we are right about this sooner than expected, that would be, in Mr. Nobody’s words, “groovy”.
Groovy!
Addendum: Incrementum 2018 In Gold We Trust Report Coming Soon!
Soon there will be a lot more gold-related information – we are happy to report that the annual In Gold We Trust report by our good friends Ronnie Stoeferle and Mark Valek of Incrementum is going to be released shortly. As always, we will make it available for download in these pages. Stay tuned!
