Since the U.S. shutdown began last week gold has been trading in a tight range between $1,277 and $1,330 per ounce. Although investors have believed that worries over the debt ceiling would be only short-lived, it seems that each day that passed without an agreement tested their nerves.
On Thursday, President Barack Obama agreed to consider a proposal from Republican lawmakers to avert a historic debt default. U.S. House of Representatives Republicans plan to offer President Barack Obama a short-term increase in the federal debt limit if he agrees to negotiate with Republicans on matters, including funding to reopen the government.
These circumstances present a potential breakthrough in the standoff that has led to 10-day partial U.S. government shutdown. From today’s point of view it seems that thanks to this development the yellow metal lost an important support. Please note that gold is considered as a hedge against political and economic uncertainty by some investors, who purchase the metal when such fears run high and reduce their holdings in favor of riskier assets like equities when these concerns fade. Therefore, yesterday, gold fell and touched a one and a half week low of $1,282 as investors cut back holdings of the haven asset.
This is gold's lowest price since the first day of the partial government shutdown. Earlier today, we saw a small pullback to $1,294, however, gold is still heading for a weekly decline. Please note that if the yellow metal closes today below $1,282, it will be its sixth decline in seven weeks, which will extend the year's losses to 23%.
In our previous essay on the price of gold in October 2013 we wrote about the debt ceiling issue. Taking into account the fact that debt ceiling talks are becoming increasingly popular in the media, we have decided to highlight this topic in our today's essay.
In short, in our view it’s highly likely that the debt ceiling will be increased and that the talks about it are really smoke and mirrors aimed to convince voters that the deal wasn’t coined already a long time ago. The debt ceiling will be increased in our view, because other options are too costly and much harder to do politically.
Will an increase in the debt ceiling end the decline on the gold market? Not likely, gold has already declined since the possible increase was mentioned. Besides, we already researched this topic over 2 years ago.
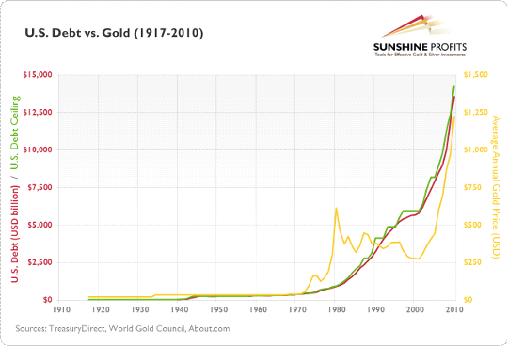
What we wrote back then remains up to date:
As you might see, gold has roughly followed the rises in the U.S. debt level since 2000. On the other hand, you will also surely notice that there were periods in gold’s history when the metal traded without visible correlation with the aforementioned debt. In short, the above chart confirms that growing uncertainty linked to the growing debt pile might fuel the price of gold, however it also confirms that markets cannot follow a given economic indicator with reasonable precision at all times and confirms what we’ve emphasized many times – that fundamental factors can only point you the general direction in which a market is going, but they do not provide timing details.
Although the link between gold and the debt ceiling might seem like a strong and positive one – it doesn’t really work on a short- and medium-term basis.
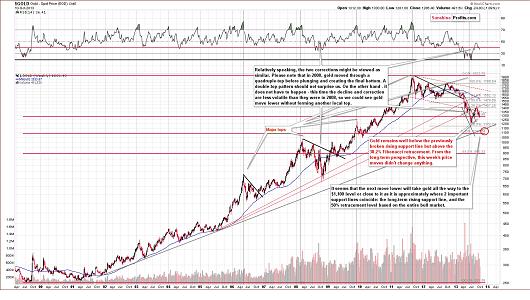
Having discussed the debt ceiling issue and its link to gold, let’s now move on to the more recent charts to find out what the current situation in the yellow metal is. Let’s start with a look at the long-term chart (charts courtesy by http://stockcharts.com).
This week’s price moves were quite visible on a short-term basis, but from the long-term point of view, they didn’t change anything as they didn’t take gold below the nearest significant support level, which is currently close to $1,285. Gold closed very close to this level, though.
At this time, we might still see an additional upswing. It will not invalidate the bearish outlook as long as it doesn’t break above the rising resistance line, which is currently more than $100 above the yesterday’s closing price (and a rally this big seems unlikely). On the other hand, we could see a breakdown below the above-mentioned support level (gold closed very close to it) and a decline to $1,100 target level.
From the long-term perspective, the outlook is bearish. The biggest question that we have concerning gold is not if it declines, because that seems quite likely, but when it will happen.
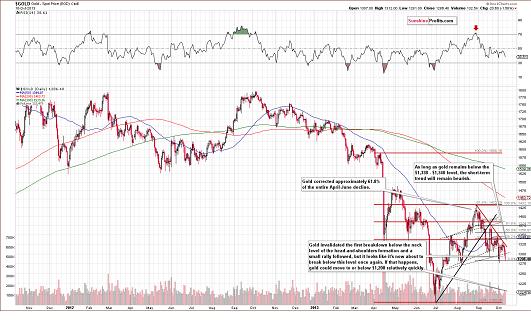
Let’s look for some answers on the medium-term chart.
On the above gold chart, we can see that the head and shoulders pattern was completed “once again.” The breakdown below the neck level hasn’t been verified just yet, and since the previous breakdown was invalidated on the very next day, we think that the outlook has deteriorated insignificantly. However, based on today’s price action, it seems that a bigger move lower is already underway.
The interesting thing about the gold market at this time is that the short-term support and resistance levels are very close to each other. Therefore, there are only several days that gold can trade without a confirmed breakout above the red declining resistance line or a confirmed breakdown below the neck level of the head and shoulders formation. It will have to move above or below one of them and then verify this move.
When we see a confirmed breakout or breakdown, it will likely determinate the next short-term move in the gold market. In our opinion, the scenario in which gold declines is more probable, as it is in tune with the medium-term trend – plus gold is already below the neck level.
The “problem” with the confirmation of a breakdown and waiting for it is – especially given the ways gold used to plunge earlier this year - that once gold starts to move lower, it could drop very fast and – as the head and shoulders pattern suggests – very far. The head of the pattern is big – bigger than $100, and that’s the type of move that we can see after the formation is completed. It was completed yesterday (without a verification, though), so such a move is now more likely than not.
- English (UK)
- English (India)
- English (Canada)
- English (Australia)
- English (South Africa)
- English (Philippines)
- English (Nigeria)
- Deutsch
- Español (España)
- Español (México)
- Français
- Italiano
- Nederlands
- Português (Portugal)
- Polski
- Português (Brasil)
- Русский
- Türkçe
- العربية
- Ελληνικά
- Svenska
- Suomi
- עברית
- 日本語
- 한국어
- 简体中文
- 繁體中文
- Bahasa Indonesia
- Bahasa Melayu
- ไทย
- Tiếng Việt
- हिंदी
Gold And Debt Ceiling - Here We Go Again
Latest comments
Loading next article…
Install Our App
Risk Disclosure: Trading in financial instruments and/or cryptocurrencies involves high risks including the risk of losing some, or all, of your investment amount, and may not be suitable for all investors. Prices of cryptocurrencies are extremely volatile and may be affected by external factors such as financial, regulatory or political events. Trading on margin increases the financial risks.
Before deciding to trade in financial instrument or cryptocurrencies you should be fully informed of the risks and costs associated with trading the financial markets, carefully consider your investment objectives, level of experience, and risk appetite, and seek professional advice where needed.
Fusion Media would like to remind you that the data contained in this website is not necessarily real-time nor accurate. The data and prices on the website are not necessarily provided by any market or exchange, but may be provided by market makers, and so prices may not be accurate and may differ from the actual price at any given market, meaning prices are indicative and not appropriate for trading purposes. Fusion Media and any provider of the data contained in this website will not accept liability for any loss or damage as a result of your trading, or your reliance on the information contained within this website.
It is prohibited to use, store, reproduce, display, modify, transmit or distribute the data contained in this website without the explicit prior written permission of Fusion Media and/or the data provider. All intellectual property rights are reserved by the providers and/or the exchange providing the data contained in this website.
Fusion Media may be compensated by the advertisers that appear on the website, based on your interaction with the advertisements or advertisers.
© 2007-2025 - Fusion Media Limited. All Rights Reserved.


