As we come to the end of 2014 and look forward to 2015, for those trading and investing in gold the perspectives and conclusions will no doubt be very different and entirely dependent on whether you are a longer term investor in the precious metal, or a short term speculator. For the former, it has been another dismal year, but for speculators trading opportunities have been legion with volatility ebbing and flowing throughout the year and this is perhaps the issue for many.
Gold as a commodity, as with equities, is generally viewed with a bullish bias with falls seen as ‘bad news’ and rising prices as ‘good news’. So from an investment perspective, 2014 has been another poor year with the metal now looking set to end below the January 2014 open of $1208.80 per ounce having touched a high of $1396.90 in March before declining steadily. Whilst 2014 was punctuated with minor rallies, none of these provided sufficient momentum to reverse this bearish trend, with the vote in December by the Swiss seen as the last hurrah for gold, and the consequent no vote snuffing out speculative gains.
For speculators, the view could not be more different. Trading gold in 2014 has once again been extremely profitable both intra-day and longer term and particularly during the latter part of the year, with the CBOE GVZ volatility index climbing off the lows of single figures in the summer months, to hit a high of 25.17 before declining to currently trade at 18.78.
So what can we expect for 2015?
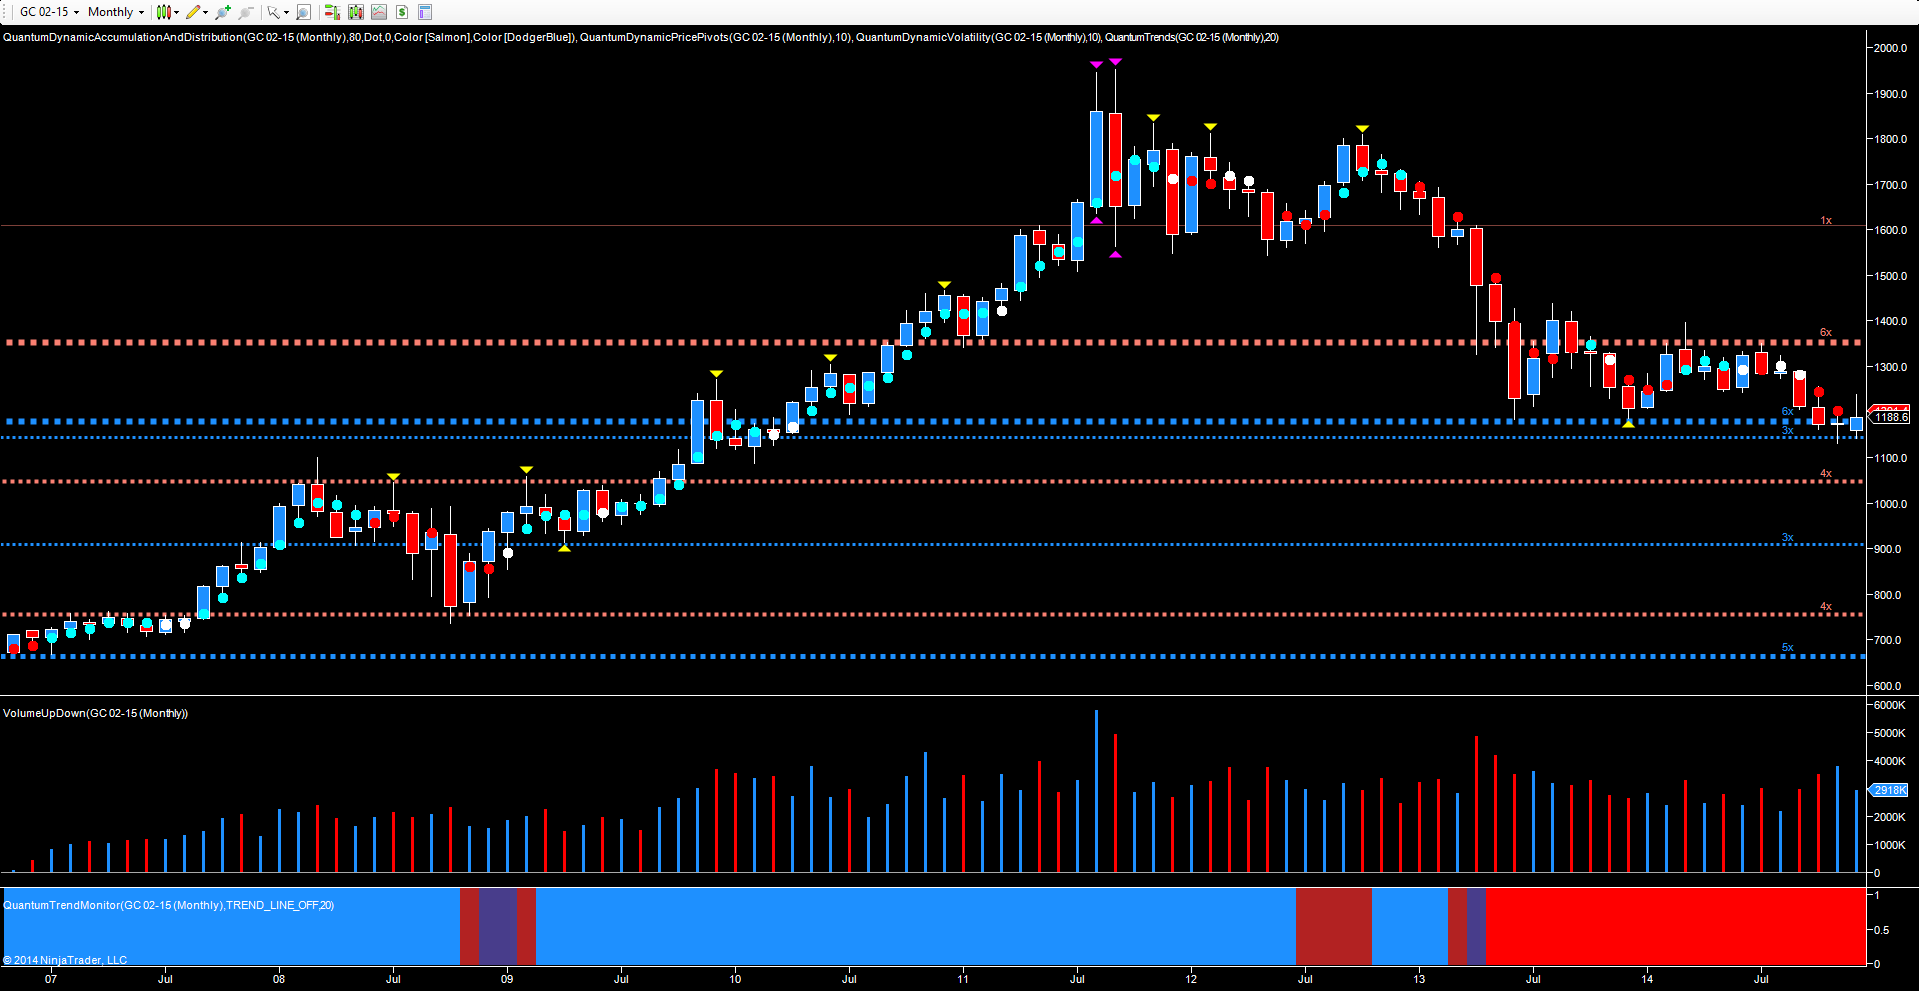
For longer term investors and from a technical perspective, gold remains heavily bearish, and if the $1180 per ounce region fails to hold (as expected), the precious metal looks set to test the $1130 per ounce region once more, with any move through this level then opening the door to a deeper move, and down towards the $1000 per ounce, all of which is neatly summed up by the monthly chart.
Here we see the key levels clearly defined, with the $1350 per ounce region denoting the strong level of resistance above, and the platform of price support now being tested at $1180 per ounce and denoted with the blue dotted line (see chart). The next significant potential support below is now in place at $1050 per ounce, with $910 per ounce also building.
Whilst these are longer term targets, the depth of price resistance overhead created during a year of consolidation in 2014, is likely to see gold lurch lower and mirror the price action of 2012/2103 with a price waterfall. Moreover, a resurgent US dollar will also add its own weight.
As always, it is volume which will confirm any longer term change in trend, and with no sign of any buying climax in this, or indeed any other time frame, then 2015 looks likely to be another bad one for longer term holders of gold. For gold speculators, the year will no doubt bring trading opportunities aplenty. Beauty as they say is in the eye of the beholder, and for gold this has never been more true.
